Data Platform Modernization: Prepare Data for Cloud Analytics
Data platform modernization goes beyond cloud migration. Learn to prepare data, pipelines, governance, and cloud architecture for scalable, reliable analytics.
- Modernization involves more than moving data to the cloud: align the platform, governance, and analytics environment with business needs.
- Use profiling and cleansing to identify quality issues before migration, then transform data to fit its intended use.
- Design cloud architecture around data flows, workload demands, and performance so the platform can scale effectively.
- Connect well-modelled data to analytics tools to support clearer reporting and more dependable insights.
- Explore how Microsoft Fabric and Power BI can work together, and where migration, modelling, and lakehouse design support the transition.
A cloud move alone doesn’t modernize a data platform. Data platform modernization means preparing and reshaping data, pipelines, architecture, and governance so cloud analytics can support reliable insights, scale, and data quality. The work includes assessing existing systems, planning the migration, and validating data as it moves.
If your data is spread across systems or your current platform makes analytics difficult to scale, it can be hard to know where to begin. That uncertainty is understandable: successful data platform modernization depends on more than choosing a cloud platform. Data readiness, business priorities, security, and target-environment design all matter.
This article explains what data modernization involves and how preparation, migration, and cloud architecture fit together. You’ll learn how a modern platform can support analytics, scalability, and data quality, and what to consider as you plan the transition.
What is Data Modernization?
Data modernization reshapes an enterprise’s data environment to support current workloads, analytics, and governance needs. It can involve migration, redesigned architecture, stronger controls, and clearer ownership of data assets.
Governance, Security, and Access Controls
Data governance defines who owns, accesses, protects, and manages data throughout its lifecycle. These controls matter during modernization because migration can change where information resides and which workloads use it. In Luxembourg, GDPR is a relevant regulation to consider when mapping data assets. Governance should connect each asset to its owner, permitted users, sensitivity, and approved purpose.
Build security controls into the migration design, rather than leaving them for a final review. For example, assign access by role, limit permissions to required tasks, and retain audit records of important access and changes. Data catalogs can help teams identify assets and classifications. Regular security audits and tested policies can expose vulnerabilities before new workloads depend on migrated data.
Modern Data Foundations and Governance Technologies
A modern data foundation combines well-organized data, repeatable pipelines, and governance technologies that support controlled use. Migration tools move and transform records; catalogs, access controls, and audit capabilities help teams manage them afterward. A successful transfer alone doesn’t make data reliable or properly governed. Organizations in Luxembourg should account for GDPR alongside business needs and technical requirements.
Start planning with an inventory of data sources, warehouses, pipelines, and reporting systems. Map each asset to its owner, purpose, quality needs, and target workload. Backups and validation during migration help protect integrity and reduce the risk of loss or corruption. For example, compare source and destination records after a transfer, investigate mismatches, and resolve them before reports rely on the new environment.
Governance technologies can centralize policy enforcement and auditing, while a data catalog makes assets easier to find and interpret. These capabilities are useful when several teams use the same information for different workloads. A customer record, for instance, may support operational reporting and analytics, but each use still needs defined access and ownership. Clear metadata also helps teams understand lineage, transformations, and the origin of reported figures.
The scale of modernization varies with existing systems and intended outcomes. That range illustrates why teams should first define scope, dependencies, and business priorities. In Luxembourg, migration, governance design, and security controls are relevant components of the work; GDPR is a relevant regulatory consideration. A Microsoft Fabric migration guide can help frame the platform transition alongside those foundations.
Pre-migration cleansing, profiling, and transformation
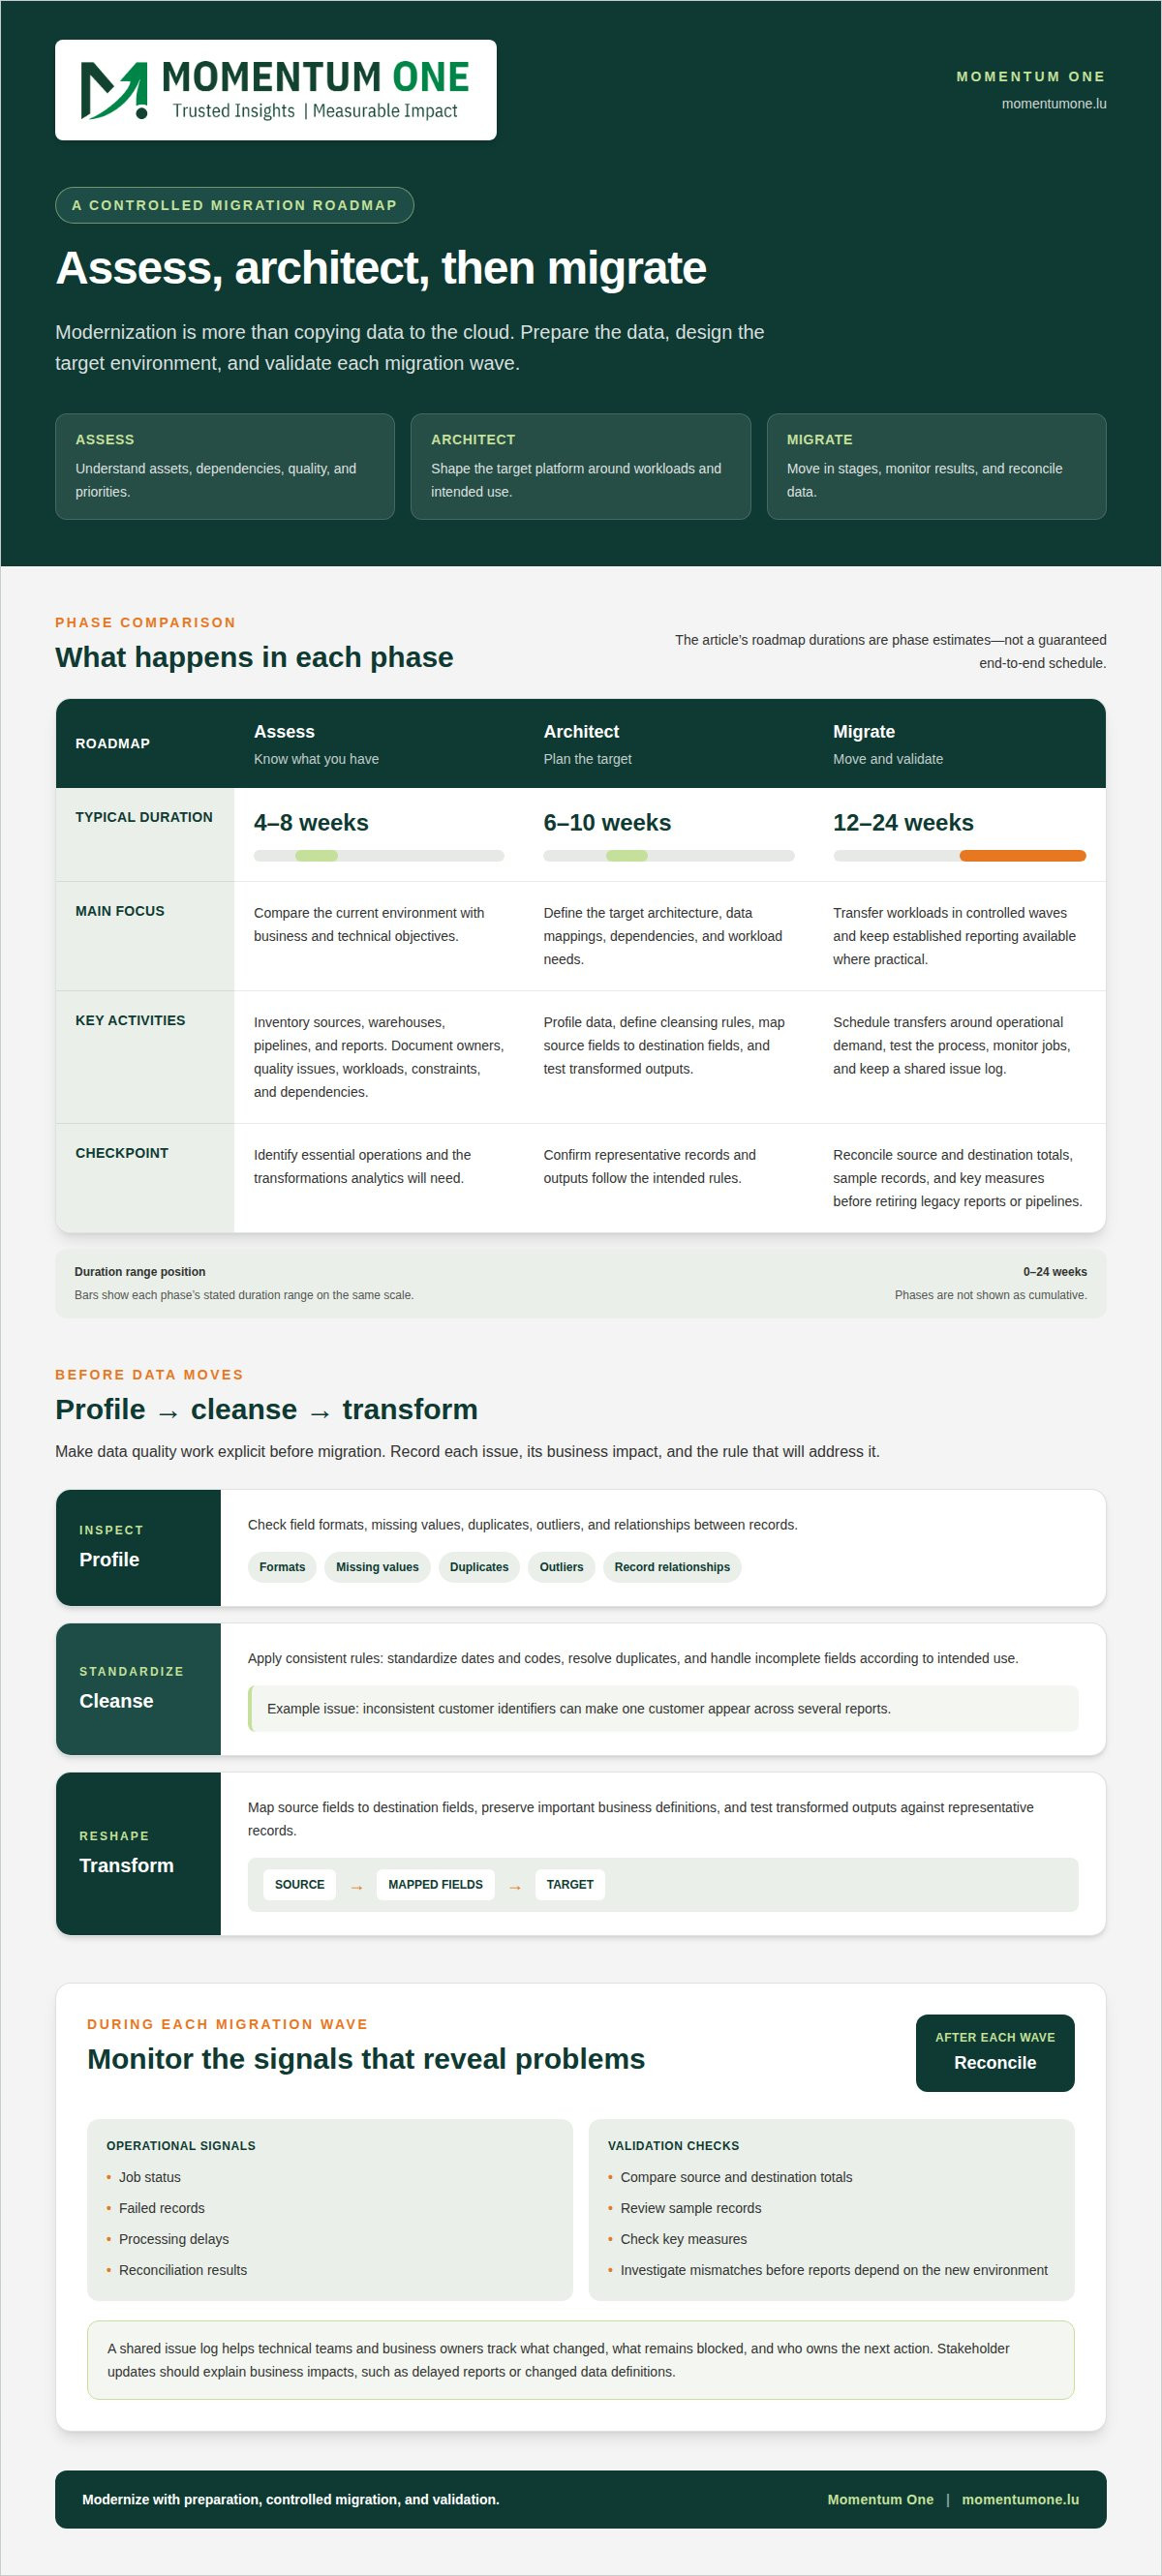
Assess a legacy platform by comparing its data sources, warehouses, pipelines, and reports with business and technical objectives. Document dependencies, data owners, quality issues, workloads, and migration constraints. This inventory reveals which assets support essential operations and which transformations analytics will require.
Costs depend on the scope, complexity, data condition, and target architecture. A roadmap gives a clearer timeline: the Assess phase typically takes 4-8 weeks, Architect 6-10 weeks, and Migrate 12-24 weeks. These durations describe phases, not a guaranteed end-to-end schedule.
Profiling establishes what source data contains before teams reshape it. Examine field formats, missing values, duplicates, outliers, and relationships between records. For example, inconsistent customer identifiers can make one customer appear across several reports. Record each issue, its business impact, and the rule that will address it.
Cleansing applies those rules consistently. Standardize dates and codes, resolve duplicates, and handle incomplete fields according to their intended use. Transformation then reshapes the cleaned data for the target platform. Define mappings between source and destination fields, preserve important business definitions, and test transformed outputs against representative records.
Plan migration in stages, based on dependencies and business importance. Move a bounded workload first, validate it, then expand to connected assets. Schedule transfers around operational demand, test the process, and use parallel systems where practical. This lets teams compare outputs and maintain access to established reporting during the transition.
Tie migration monitoring to clear operational signals: job status, failed records, processing delays, and reconciliation results. A shared issue log helps technical teams and business owners see what changed, what remains blocked, and who owns the next action. Regular stakeholder updates should explain impacts in business terms, such as delayed reports or changed data definitions.
After each migration wave, reconcile source and destination totals, sample records, and key measures. Investigate mismatches before retiring legacy reports or pipelines. Auditing mapping and transformation rules also records how outputs were produced. Training can then show report users where data comes from and how changed definitions affect their analysis.
A practical roadmap links the work: assess the current environment, design the target, migrate in controlled waves, and validate each result. Review progress with stakeholders and adjust sequencing when dependencies or data-quality issues emerge. This keeps decisions connected to business priorities, rather than treating migration as a simple copy operation.
Cloud platform architecture and performance optimization
Cloud architecture determines how data moves, where it is stored, and how it supports analytics workloads. A strong design connects platform capabilities to business needs while keeping performance visible and manageable.
Cloud Adoption and Data Management
Cloud adoption moves data workloads into cloud environments, where architecture and operating practices shape how teams manage them. Scalable, cloud-first pipelines support data ingestion and transformation as demand changes. For example, separating ingestion from reporting can let teams adjust one workload without redesigning the entire environment.
Architecture choices should reflect data sources, processing patterns, and analytics requirements. Assess where data is created, how quickly it must be available, and which transformations support reporting. These decisions guide storage and processing patterns, while monitoring reveals bottlenecks such as slow ingestion or inefficient queries.
Performance optimization is an ongoing design activity. Review pipeline stages, query patterns, and workload demand, then tune the part limiting the user experience. A cloud platform can scale capabilities, but scaling alone won’t fix poorly designed transformations or unnecessary data movement. When addressing critical software bottlenecks, engineering specialists such as The Code Factory can assist with production readiness reviews and code remediation to ensure system stability.
Hybrid and Multi-Cloud Approaches
A cloud-native architecture is designed around cloud services, while a hybrid environment connects cloud and existing systems. Multi-cloud designs use services across cloud environments. Each approach affects how data moves, how teams operate pipelines, and where governance controls must apply.
For a hybrid design, define which workloads remain in existing environments and which move to the cloud. Map dependencies between them, then design secure, observable data flows. A multi-cloud approach also needs clear ownership of integrations and consistent definitions, so users can interpret data reliably across platforms.
Choose an approach based on the actual workload and operating model, not its label. A report that depends on frequently refreshed source data, for instance, may need a different pipeline design from a periodic historical analysis. Documenting these patterns helps teams plan capacity and locate performance issues.
Platform Technologies and Project Skills
Data warehouses, data lakes, and lakehouse architectures support different storage and analytics needs. A lakehouse brings data-lake and warehouse capabilities together to support scalable analytics. Microsoft Fabric unifies data engineering, analytics, and business intelligence, helping teams connect platform design with reporting needs.
Common project roles include data architects, engineers, governance and security specialists, and analytics owners. Architects shape environments and integration patterns; engineers build and tune pipelines. Governance specialists define access and controls, while business stakeholders clarify workload priorities and validate that outputs support real decisions.
When reviewing an Informatica Cloud Data Integration case study, focus on its architecture, integration requirements, and performance measures. Consider which sources and targets were connected, how transformations were handled, and how teams monitored failures. This makes a case study a useful design reference without assuming its results will apply to every environment.
Connect performance work to user impact. Track pipeline completion, query responsiveness, and data freshness against each workload’s needs. A modernization team can then prioritize changes, test them with representative workloads, and document the resulting architecture for ongoing operations.
Benefits for analytics, scalability and data quality
Modern data foundations connect information from separate sources and make it more useful for analytics. The value comes from combining accessible data, consistent definitions, and processing capacity suited to each workload. A sales team, for example, can use a shared view of orders and customer activity instead of reconciling separate reports manually.
A lakehouse combines data-lake and data-warehouse capabilities to support scalable analytics. It can bring varied data sources together for structured reporting and broader analysis. This foundation helps teams explore detailed information without maintaining an entirely separate environment for every use. The architecture still needs clear data models, ownership, and quality rules so shared access produces consistent insights.
Data quality directly affects the reliability of analytics and predictive outputs. If product identifiers vary between source systems, reports may split one item into several categories. Profiling, standardization, and validation help address these issues before business users rely on the results. Teams can also monitor freshness and completeness, then trace unexpected figures through transformations back to their source.
Scalability helps a platform handle changing data volumes and analytical demand. Cloud-based processing can be designed around workload requirements, rather than forcing every task through the same rigid pipeline. Legacy batch processing and inflexible ETL pipelines can delay decisions when teams need fresher information. Rebuilding pipelines with scalable, cloud-first designs supports faster ingestion and transformation.
Real-time analytics can make operational signals useful sooner. For example, timely equipment data can help teams identify patterns that deserve investigation, while predictive models can inform maintenance planning. Gogo achieved a 75% drop in its no-fault-found rate using predictive Big Data analytics. That result illustrates a specific use case, not a promised outcome for every organization.
Business intelligence becomes more dependable when reports share governed definitions and well-modelled data. A global manufacturing provider reported raising its sales forecast confidence score from 20% to 90%. The example shows how improved data and analytics can support planning, but the relevant measures depend on each business decision. Teams should connect report metrics to clear definitions and trusted sources.
AI readiness also depends on data that is accessible, relevant, and consistently described. Before applying artificial intelligence, teams need to understand where information originates, how it changes, and whether it suits the intended analysis. A practical sequence is to define the use case, identify required sources, assess quality, and establish repeatable transformations. This gives analytics and AI work a clearer foundation, while making data limitations visible before they distort results.
Microsoft Fabric analytics and Power BI integration
Microsoft Fabric brings data engineering, analytics, and business intelligence together. Power BI can use prepared data to turn integrated sources into governed reports and insights.
Data Integration, Quality, and Warehousing
Data integration combines information from different sources, while warehousing organizes it for analysis. Together, they help teams work from consistent data instead of disconnected extracts. For example, orders and customer details can be aligned before analysts build sales reports, reducing conflicting definitions across dashboards.
Build quality checks into the integration flow. Validate required fields, standardize formats, and investigate unexpected values before loading data for reporting. A warehouse or lakehouse can then provide a structured foundation for analytics. Its design should reflect how teams query information, which data they need, and how governance controls apply.
Power BI reports depend on these foundations. A clear model links measures to business definitions, so sales totals mean the same thing across reports. For regulated workloads, align access and auditing with governance policies, including relevant privacy requirements such as GDPR.
Unified Data Pipelines
Unified pipelines coordinate data movement and transformation through a consistent, observable process. In Microsoft Fabric, connected data engineering and analytics capabilities can support the flow from source systems to reporting. This matters when separate manual pipelines duplicate logic or make changes difficult to trace.
Map each pipeline to its source, transformation, destination, and downstream report. For example, a customer dataset might combine records from sales channels, service systems, and modern VoIP infrastructure from providers like Nexgen Australia before supporting a Power BI dashboard. Monitor pipeline failures and data freshness, and make ownership clear so the right team can resolve issues.
Teams maintaining 100+ manual pipelines may save engineering time by consolidating and simplifying their pipeline practices. The objective is not to combine every flow indiscriminately. Group pipelines by business purpose and dependency, then standardize repeatable transformations while preserving the distinctions that reports require.
ETL and ELT Integration
ETL extracts, transforms, then loads data; ELT loads data before transforming it in the target platform. The choice affects where processing happens and how teams manage transformation logic. Teams might, for example, clean sensitive fields before loading, or load raw data and transform it for a defined analytical use.
Choose the pattern according to source constraints, target capabilities, quality controls, and the workload’s need for fresh data. In either case, document transformation rules and test representative outputs. This makes it easier to trace a Power BI measure through its model and pipeline to the original source.
Well-planned integration can accelerate analytics and create room for innovation without losing sight of data quality. If you’re shaping a Fabric and Power BI roadmap, discuss your data integration needs.
Momentum One: Fabric Migration & Modernization
Momentum One helps organizations plan and deliver Microsoft Fabric migration and modernization around their analytics needs. Turn to this support when legacy data environments, disconnected pipelines, or reporting requirements make a cloud transition difficult to coordinate.
The work can include shaping a migration approach, designing a data warehouse or lakehouse, and aligning data models and DAX with Power BI use cases. Training can also help teams build the skills to work confidently with the modernized platform. The right focus depends on your existing architecture, data quality, and intended workloads.
If you’re planning a Fabric transition or refining an existing analytics platform, contact Momentum One to discuss your goals.
Build a Clear Path to Cloud Analytics
The next step is to turn modernization priorities into a platform plan your teams can operate and develop. Connect the architecture to the decisions people need to make, then assign ownership of the data, models, and reporting that support those decisions. This keeps technology choices grounded in practical outcomes.
Momentum One supports this work through Fabric Migration & Modernization, Analytics Strategy & Governance, and Data Modeling & DAX Optimization. These services can help align migration, governance, and the analytics layer as your organization advances its data platform modernization plans.
Whether you’re defining a roadmap or addressing a specific challenge in an existing environment, a focused discussion can help clarify priorities and next steps. Contact Momentum One to discuss modernization and shape a practical path forward for your cloud analytics goals.
Frequently Asked Questions
What is data platform modernization and what are its benefits?
Data platform modernization updates how an organization stores, processes, and uses data, making analytics more adaptable to changing needs. One practical benefit is connecting operational and historical information to support decisions such as inventory planning. Modernization can also make reporting easier to maintain as teams and business questions evolve. The benefits depend on aligning platform design with real work, rather than moving existing processes unchanged.
What are the key steps in a data platform modernization roadmap?
A useful roadmap moves from business priorities to architecture decisions, then to controlled implementation and operational handover. First, define the decisions and reports the platform must support. Next, map dependencies and select a target design. Set acceptance criteria before migration, such as whether critical reports reconcile and owners can access the data they need. After release, assign responsibility for monitoring, issue handling, and platform changes so modernization becomes part of ongoing operations.
How do cloud data warehouses compare with data lakes and lakehouses?
A cloud data warehouse organizes data for structured queries and reporting, while a data lake can hold varied data in its original or transformed form. A lakehouse combines characteristics of both, supporting diverse data alongside analytics. For example, finance teams may prioritize consistent, modeled reporting, while data science teams may need broader source material. Choose according to data formats, access patterns, governance needs, and the workloads the platform must support.
How can organizations migrate data and workloads with minimal downtime?
Reduce disruption by agreeing on cutover criteria before switching users to the new environment. For a finance reporting workload, teams can compare key outputs in the target platform while established reports remain available. Define who approves the switch, how unresolved differences are handled, and how operations resume if a critical dependency fails. Tell users which reports are affected and when, then retire the old path only after acceptance criteria are met.
What are the main risks and challenges of modernizing a data platform?
Common risks include overlooked dependencies, inconsistent definitions, access errors, and performance problems that emerge under real workloads. A sales dashboard might load correctly but show different totals if its source mapping changed. Manage these risks with named owners, documented definitions, role-based permissions, and workload-based testing. User adoption is another challenge: explain changed metrics and workflows to report consumers, and give them a clear way to report issues after the transition.