How to reduce clutter and tune DAX in Power BI data models
Tackle Power BI data modeling challenges by removing redundant fields, clarifying relationships, and simplifying DAX while preserving the context reports need.
- Align data engineering decisions with reporting needs so data arrives clean, consistent, and ready to model.
- Keep tables and columns that support active reporting needs, and remove fields that add clutter without informing decisions.
- Use a clear star schema and deliberate relationships to make filtering and report behavior easier to understand.
- Favor measures for calculations that need to respond to report filters, and simplify DAX so its logic is easier to maintain.
- Choose a model’s grain to match the detail required for analysis, then shape facts and dimensions around that level.
You probably don’t need every table and column in your Power BI model. Keep the fields that support reporting, analysis, and essential business logic, and remove those that don’t. Power BI data modeling challenges often arise when engineering decisions and reporting needs drift apart, leaving teams with unnecessary data, confusing relationships, or DAX that’s harder to maintain.
A large Power BI model can be difficult to untangle, especially when it combines data from different sources or has grown around reports that are no longer used. The answer is not simply to delete more. First agree on what the model needs to do, then shape its data and calculations around that purpose.
This guide explains how to align data engineering with Power BI development, identify redundant fields, organize tables and relationships, and improve DAX calculations. You’ll learn a practical way to reduce clutter while preserving the context and measures people need to trust their reports.
1. Alignment between data engineering and Power BI developers
A reliable Power BI model starts before data reaches the reporting layer. Data engineers and report developers need shared definitions for business terms, data types, refresh expectations, and ownership. In complex environments, platforms like Syntes AI help unify disparate data into a structured enterprise knowledge graph so teams share a coherent view of their entities. For example, agreeing whether “revenue” means invoiced sales or booked sales before creating a measure prevents teams from building conflicting calculations from the same source.
Use a short requirements workshop to connect each report question to its source fields and transformation rules. Then document data owners, validation checks, and assumptions alongside the model. When engineering combines sources, test keys, nulls, duplicates, and date formats before release. A shared data foundation, such as OneLake as a single source of truth, can also clarify where curated data is maintained.
Import, DirectQuery, and composite models each involve trade-offs. Import stores data in the model for responsive report queries, but requires refreshes to reflect source changes. DirectQuery queries the source while a report is in use, so source performance and query design matter. Composite models combine storage modes, offering flexibility while increasing design and troubleshooting complexity.
For time intelligence, use a dedicated date table with unique, continuous dates, then relate it to the relevant fact-table date. Mark it as the model’s date table and use its fields consistently in reports. This gives calculations such as year-to-date revenue a dependable calendar context, rather than relying on inconsistent date columns from individual source systems.
Model size and high-cardinality columns can increase memory use and slow refresh or queries. Text fields with many distinct values, such as transaction references, often compress less efficiently than repeated categories. Review whether each field supports reporting, and use numeric keys for relationships where appropriate. For models over 5 GB, incremental refresh can limit processing to recent data while retaining historical partitions.
Row-level security (RLS) adds another coordination point because role filters must match the model’s relationships and intended user access. Test each role with representative users and report paths before publishing. Incremental refresh also requires partitioning and date filters. Engineering and Power BI developers should agree on the date column and refresh policy together. A mismatch can leave users with incomplete or incorrectly filtered data.
Keep the handoff practical: define business terms, validate source data, agree on storage mode, and test security and refresh behavior. These steps help resolve Power BI data modeling challenges before they become report defects. They also give engineering and development teams a shared basis for evolving the model as reporting needs change.
2. Reporting purpose and unnecessary tables or columns
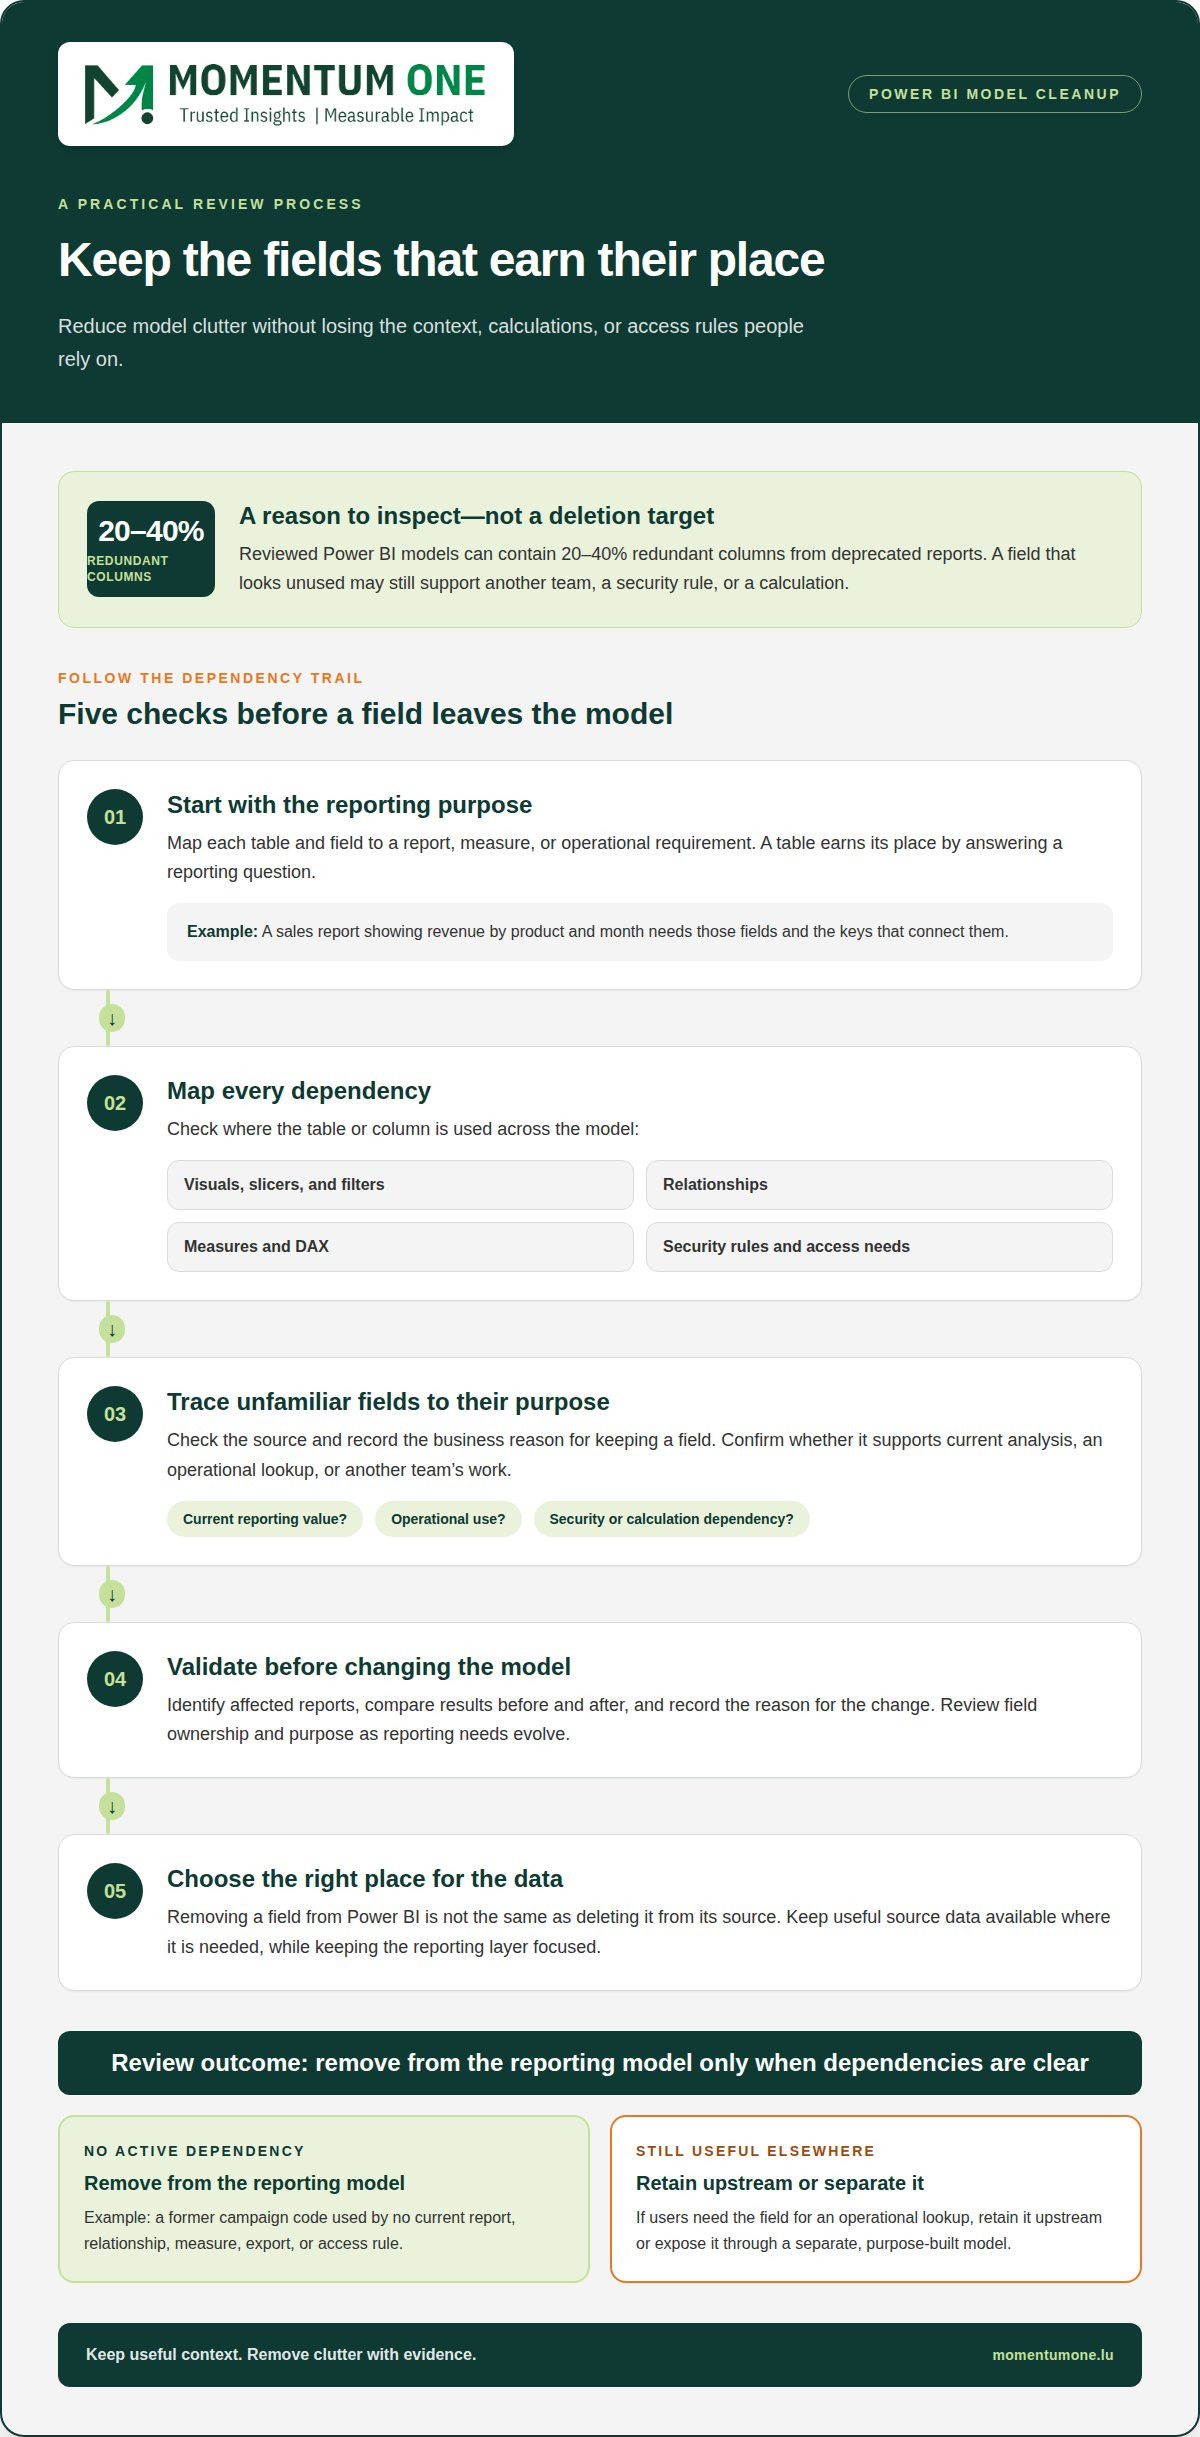
A Power BI table earns its place by answering a reporting question. If a sales report tracks revenue by product and month, it needs those fields and the keys connecting them. A legacy column used only by a retired report adds weight without helping anyone make a current decision. Map each table and field to a report, measure, or operational requirement.
That audit often uncovers historic leftovers. Reviewed Power BI models can contain 20-40% redundant columns from deprecated reports. Treat that figure as a reason to inspect, not a target for deleting a fixed share. A field that looks unused in one report may support another team’s analysis, a security rule, or a calculation hidden in a measure.
Use a structured review before removing anything:
- List the reports, dashboards, and measures that depend on each table.
- Identify columns used in visuals, slicers, filters, relationships, and DAX.
- Trace unfamiliar fields to their source and record their business purpose.
- Confirm that an apparently obsolete field has no active reporting or security role.
For example, a customer table might contain a former campaign code that no current report uses. If no relationship, measure, export, or access rule depends on it, remove it from the reporting model. If users still need the code for an operational lookup, retain it upstream or expose it through a separate, purpose-built model. This keeps the reporting layer focused without erasing useful source data.
Distinguish between removing a field from Power BI and deleting it from its source. The first reduces model clutter; the second may affect other systems or teams. A controlled change identifies affected reports, compares results before and after, and records the reason. Resolving Power BI data type issues can also prevent avoidable inconsistencies in data types and transformations.
Keep useful context, not every available attribute. A date dimension may need calendar labels for reporting, while raw timestamps or source-system metadata may not belong in the user-facing model. Likewise, when ingesting catalog data from enterprise platforms like Ommni, a product table can retain category and brand fields used for analysis while dropping duplicate descriptions that add no distinct reporting value.
Finally, review usage and ownership on a regular schedule. A field’s purpose can change as reports evolve, so record the owner and the decision behind each removal. For support assessing model structure and field dependencies, discuss your reporting model.
3. Star schema design and relationship management
A star schema gives each report a clear path from business context to measurable results. Place transactions, sales, or revenue in a fact table, then connect it to dimensions describing customers, products, dates, or locations. For example, a Sales fact table can link to Product and Date dimensions, letting users filter revenue by product category and reporting period.
Keep the grain consistent: each row in a fact table should represent the same kind of event, such as one order line. Then choose dimension keys that uniquely identify each customer, product, or date. Numeric IDs are generally preferable for joins to text labels, which can vary in spelling or format. Keep descriptive attributes in dimensions rather than repeating them across every sales row.
Build relationships from dimensions to facts as one-to-many, with the dimension on the “one” side. Use single-direction filtering by default, so a selected product filters its sales without creating extra paths through the model. This makes report behavior easier to follow. Advanced data modeling techniques can help address more complex structures as analytical needs grow.
Before adding a relationship, establish its intended meaning and direction:
- Check that the dimension key contains unique values.
- Confirm the fact table contains matching foreign keys.
- Set the relationship active when it should filter reports by default.
- Test totals with representative filters, such as product and date.
A Sales table might contain both Order Date and Delivery Date, but only one relationship to a Date table can be active by default. Keep the other relationship inactive, then use USERELATIONSHIP() in a measure when a report needs delivery-date analysis. This preserves clear default behavior while supporting an alternative view.
Bidirectional filtering can seem to solve a difficult filter path, but it may create ambiguity when tables connect through several routes. For example, filtering Customers through both Sales and a separate Returns table can produce unclear totals. Prefer a simpler relationship path. Use bidirectional filtering only when the model requires it and its effects have been tested.
Finally, validate the model against real report questions. Compare total sales before and after applying a customer, product, or date filter. If a total changes unexpectedly, inspect duplicate dimension keys, unmatched fact keys, and competing relationship paths. These checks turn a diagram into a dependable reporting structure.
4. DAX formula optimization
DAX performance depends on both formula design and the model being queried. Start by expressing each reporting requirement as a clear business definition. For example, “net sales” should specify whether returns and discounts are included. A shared definition helps prevent different measures from calculating different versions of the same metric.
Choose measures for calculations that must respond to report filters. Measures are evaluated dynamically as users filter by product, date, or region. Calculated columns are evaluated row by row and stored in the model, increasing its memory footprint. A customer segment that never changes may suit a column, while filtered revenue belongs naturally in a measure.
Before adding complex logic, inspect the filter context. A measure can return an unexpected result when filters come from multiple tables or relationships. For example, a sales total filtered by product should respond to the selected products, not ignore them. Keep calculations focused, use variables for repeated expressions, and test results with the slicers used in reports.
Time calculations need a dependable date context. A three-month moving average for revenue should use a proper date table and a clearly defined rolling window. Check the result at different levels, such as month and year, because a formula can behave differently when a visual changes its grouping. Validate the first and last periods too, when fewer dates may be available.
Translate business questions into explicit measure behavior before optimizing:
- For repeat purchase rate, define the customer set as those ordering more than once in the last 90 days.
- For a discount simulation, use a disconnected slicer with options of 5%, 10%, and 15%.
- For sales contribution, identify cities reaching at least 2% of total sales for the selected time period.
These examples clarify which filters a measure should respect and which values it must compare. A discount simulation, for instance, should calculate an adjusted result from the selected option without changing source sales data. Test each choice against a small set of known transactions before using the measure across a report.
When a measure is slow, review its dependencies before rewriting the formula. Check whether it iterates over a large fact table, repeats the same expression, or uses a filter that removes useful context. A focused DAX optimization review can help identify demanding calculations, particularly in large datasets.
Finally, name measures by business purpose, group related calculations, and document unusual assumptions. Compare totals with a trusted source and test key filters after each change. This makes DAX easier to maintain as reporting needs evolve, and helps teams distinguish a formula issue from a model relationship or data-quality problem.
5. How do you choose the right grain for a Power BI data model?
Grain defines what one row represents in a fact table. Choose it by identifying the smallest business event users need to analyse. For sales, that might be one order line rather than one row per order. The chosen detail determines which questions the model can answer without reconstructing information later.
Start with reporting decisions, not source-table structure. If users compare products within an order, an order-level total hides essential detail. If they track only daily revenue, transaction-level rows may add volume without serving the report. State the intended row meaning in plain language, then check each required visual and measure against it.
Different business processes often need different grains. Sales transactions and monthly inventory snapshots describe distinct events, so forcing them into one fact table can distort calculations. Keep separate fact tables, then connect them through shared dimensions such as Date, Product, or Location. This lets a report compare related measures without treating snapshots as transactions.
Use a few practical questions to define the grain:
- Does one row represent an order, an order line, or a daily summary?
- Can the source provide the detail needed for the required product and date filters?
- Will a total remain valid when users group results by customer or location?
- Do separate processes, such as sales and returns, require separate fact tables?
Consider a sales report that needs revenue by product and month. An order-line grain preserves product detail, while the Date dimension supports monthly grouping. If the source contains only daily product totals, users can compare products by day or month but cannot analyse individual orders. The model’s grain sets that boundary.
Aggregation can reduce model volume, but it also removes detail. A daily summary may suit trend reporting, while service teams might need individual transactions to investigate an unusual result. Retain the lowest grain that supports genuine reporting requirements, and create summaries when faster analysis needs them. Document which reports use each level to prevent inconsistent totals.
Validate measures against the chosen grain before publishing. For example, count order IDs distinctly when a transaction spans multiple order lines; otherwise, a row count can overstate orders. Compare a product-level total with monthly and overall totals. If the values do not reconcile, inspect duplicate keys, missing rows, and aggregation logic.
A clear grain statement makes later changes easier to assess. If a new report needs shipment-level detail, determine whether the source captures shipments before extending the model. For help reviewing grain, fact tables, and reporting requirements, discuss your data model.
Momentum One: Data Modeling & DAX Optimization
Momentum One helps teams address model structure, relationships, and DAX calculations through Data Modeling & DAX Optimization. Turn to this service when reports are slow, measures produce inconsistent results, or teams struggle to maintain a model as reporting needs change.
The focus is practical: connect model design to business questions, clarify calculation logic, and shape data for reliable reporting. If the underlying warehouse or lakehouse design contributes to model complexity, Data Warehouse & Lakehouse Design can address that foundation. Corporate training can also help teams build the skills to maintain models and measures confidently.
Bring your reporting goals and the model issues you’re working through. Contact Momentum One to discuss a suitable next step.
Make your model easier to evolve
A Power BI model should support the decisions your organisation needs next, not just preserve assumptions behind yesterday’s reports. As teams, data sources, and reporting priorities change, treat model maintenance as part of ongoing analytics work. A focused review can identify where structure, governance, or platform choices are getting in the way.
Power BI data modeling challenges may call for different kinds of support at different stages. Momentum One offers Power BI Consulting, Governance & Performance for model oversight, Microsoft Fabric Migration & Modernization for platform change, and Data Modeling & DAX Optimization for model and calculation improvements. The right starting point depends on the issue you want to address.
Share the reporting outcomes you’re working toward and the model constraints affecting them. Contact Momentum One to discuss your model, and take the next step toward analytics that can adapt with your business.
Frequently Asked Questions
Do you really need all those tables and columns?
No. Retain fields only when they serve reporting, calculations, security, or a defined operational purpose. Before removing one, inspect dependencies such as hidden report pages, measures, exports, and downstream models. For example, a column absent from visible charts might still drive a filter on a drill-through page. Remove obsolete fields from the reporting layer only after understanding their dependencies, and preserve source data needed by other processes.
Where to start optimizing?
Start with the report problem users notice most, such as a slow visual or a total that changes unexpectedly. Reproduce it with a specific page, filter, and measure, then isolate whether the cause lies in the source query, model structure, relationship path, or DAX expression. This creates a focused diagnosis rather than a broad redesign. Record the current result first so you can compare behavior after each targeted change.
What are the most common Power BI data modeling challenges?
Common Power BI data modeling challenges include inconsistent business definitions, redundant fields, unclear relationship paths, and calculations that are difficult to maintain. These problems often interact: duplicated customer records can distort totals, while an ambiguous relationship can make a correct measure appear wrong. Treat each symptom as a clue. Trace a reported discrepancy from the visual through its measure and relationships to the underlying source rows.
How should fact and dimension tables be designed in Power BI?
Design fact tables around measurable business events, and use dimensions to describe those events. For example, a returns fact table can record returned quantities and values, while Product and Reason dimensions explain what was returned and why. Keep separate processes in separate facts when their events differ. Shared dimensions can support comparisons, while clearly named measures distinguish returned value from sales value.
How do relationships, cardinality, and filter direction affect Power BI models?
Cardinality describes how values match across related columns, while filter direction determines how selections travel through the model. A unique customer key in one table can filter matching transaction rows in another. Duplicate keys on the supposed “one” side can prevent that relationship from behaving as intended. Check key uniqueness and unmatched values, then test a customer selection against a known transaction total.
When should you use a star schema versus a snowflake schema in Power BI?
Use a star schema when report users benefit from direct, clear paths between facts and descriptive dimensions. A snowflake schema separates a dimension into related tables, which can suit normalized source structures or shared hierarchies. For instance, product attributes and category data may be stored separately upstream. Choose based on clarity, data maintenance, and reporting needs, then test that slicers and totals behave as users expect.
How can you handle many-to-many relationships and ambiguous filter paths in Power BI?
For many-to-many matches, a bridge table can list valid links between entities, such as customers and accounts, with each relationship represented explicitly. Connect the bridge to both sides and control how filters propagate. If a physical relationship would create competing paths, a measure using TREATAS() can apply selected values as a virtual relationship. Validate the measure with overlapping selections and expected totals.
How can you optimize Power BI models with DAX measures, calculated columns, and aggregations?
Use a measure when a result should recalculate under report filters, and reserve a calculated column for row-level attributes needed repeatedly. For large transaction data, an aggregation table can answer common summaries without querying every detail row. Keep detailed data available when users need transaction-level investigation. Compare aggregated results with detail-level totals across relevant filters, especially when dimensions or date ranges change.