Microsoft Fabric pricing, costs and executive ROI
Learn what is Microsoft Fabric for executives, how capacity pricing works, and how to assess ROI, align teams, and make a focused analytics investment.
- Map Fabric’s workloads to the Microsoft tools and business processes your teams already use to see where it can simplify data access and reporting.
- Build the ROI case around measurable opportunities such as reducing duplicated platform work, improving data team productivity, and speeding up analysis.
- Estimate capacity costs against workload needs, then compare the full platform investment with the tools and effort it could replace.
- Start with a focused use case and plan implementation around your existing data estate, migration complexity, and team readiness.
- Give an executive sponsor clear responsibility for priorities, resources, governance decisions, and adoption across business and technical teams.
Microsoft Fabric is not just another analytics purchase; it’s a decision about how your organisation brings data and decision-making together. Understanding what Microsoft Fabric is for executives means looking beyond its technology: Fabric connects analytics workloads through OneLake and works with Microsoft tools such as Excel and Teams. Its costs depend on the capacity and resources your workloads need, while potential returns can come from more efficient data work and consolidating tools.
It’s reasonable to want a clear view of the investment and business value before committing. Microsoft Fabric can bring data integration, engineering, warehousing, and reporting into a shared platform, but its value depends on choosing useful business outcomes and adopting it effectively.
This guide explains how Fabric fits with Microsoft 365, Azure and Dynamics 365, how capacity-based pricing works, and where executives can look for return on investment. It also covers why sponsorship matters: leaders help set priorities, align teams and make sure analytics supports real decisions, not just a technology rollout.
Integration with Microsoft 365, Azure and Dynamics 365
Microsoft Fabric brings data integration, engineering, warehousing, data science, real-time analytics, and reporting together in a software-as-a-service platform. Compared with Power BI, Fabric covers more of the data lifecycle, while Power BI focuses on analytics and reporting. Azure Synapse, Databricks, and Snowflake are separate platforms with overlapping data and analytics capabilities. The practical question is how each fits your existing architecture and workloads.
Its main components include OneLake, Data Factory, lakehouses, warehouses, pipelines, notebooks and Power BI. OneLake acts as a shared logical data lake across Fabric workloads, reducing the need to move or duplicate data between them. Fabric Data Factory supports data ingestion, preparation and transformation, with more than 200 native connectors for cloud and on-premises sources. Data Engineering adds Apache Spark and notebooks for processing and scheduling transformations.
Microsoft 365 connections make analytics more useful in familiar workflows. Teams can share insights, while Excel can analyze data, helping leaders move from reporting to decisions without treating a dashboard as the only destination. For example, a finance team could review a governed business measure in Power BI, then use Excel to explore the underlying analysis and share findings through Teams.
Azure provides the underlying technology foundation for several Fabric capabilities: OneLake is built on Azure Data Lake Storage Gen2. Organisations can use Fabric without an Azure account, and Fabric workloads can connect to cloud and on-premises data sources. For Dynamics 365, bringing operational data into shared analytics can help connect business activity with reporting. Data Factory provides the integration capability; the specific source and access design depend on the organisation’s setup.
Fabric also connects with Microsoft Foundry for machine-learning and AI scenarios, including model development, deployment, and inference. Its Data Science workload supports building and operationalising machine-learning models, with Azure Machine Learning integration for experiment tracking and model registry. Copilot features can assist with authoring queries, pipelines, and code, as well as generating summaries and insights. These tools can help teams explore data, but consistent business definitions remain essential for useful results.
Governance and security capabilities include centralized data discovery, access control and governance across Fabric workloads. This gives organisations a shared foundation for managing who can access data and how it is used. For enterprise planning, define data ownership, access rules and quality expectations alongside the architecture. A Microsoft Fabric governance framework can help structure those decisions before teams scale reporting or AI use cases.
Fabric return on investment and financial benefits
Microsoft Fabric’s potential return comes from reducing platform effort and helping teams turn data into decisions faster. Executives and business users may benefit from unified analytics, less repetitive data preparation, and reporting built on consistent measures.
Return on investment and payback
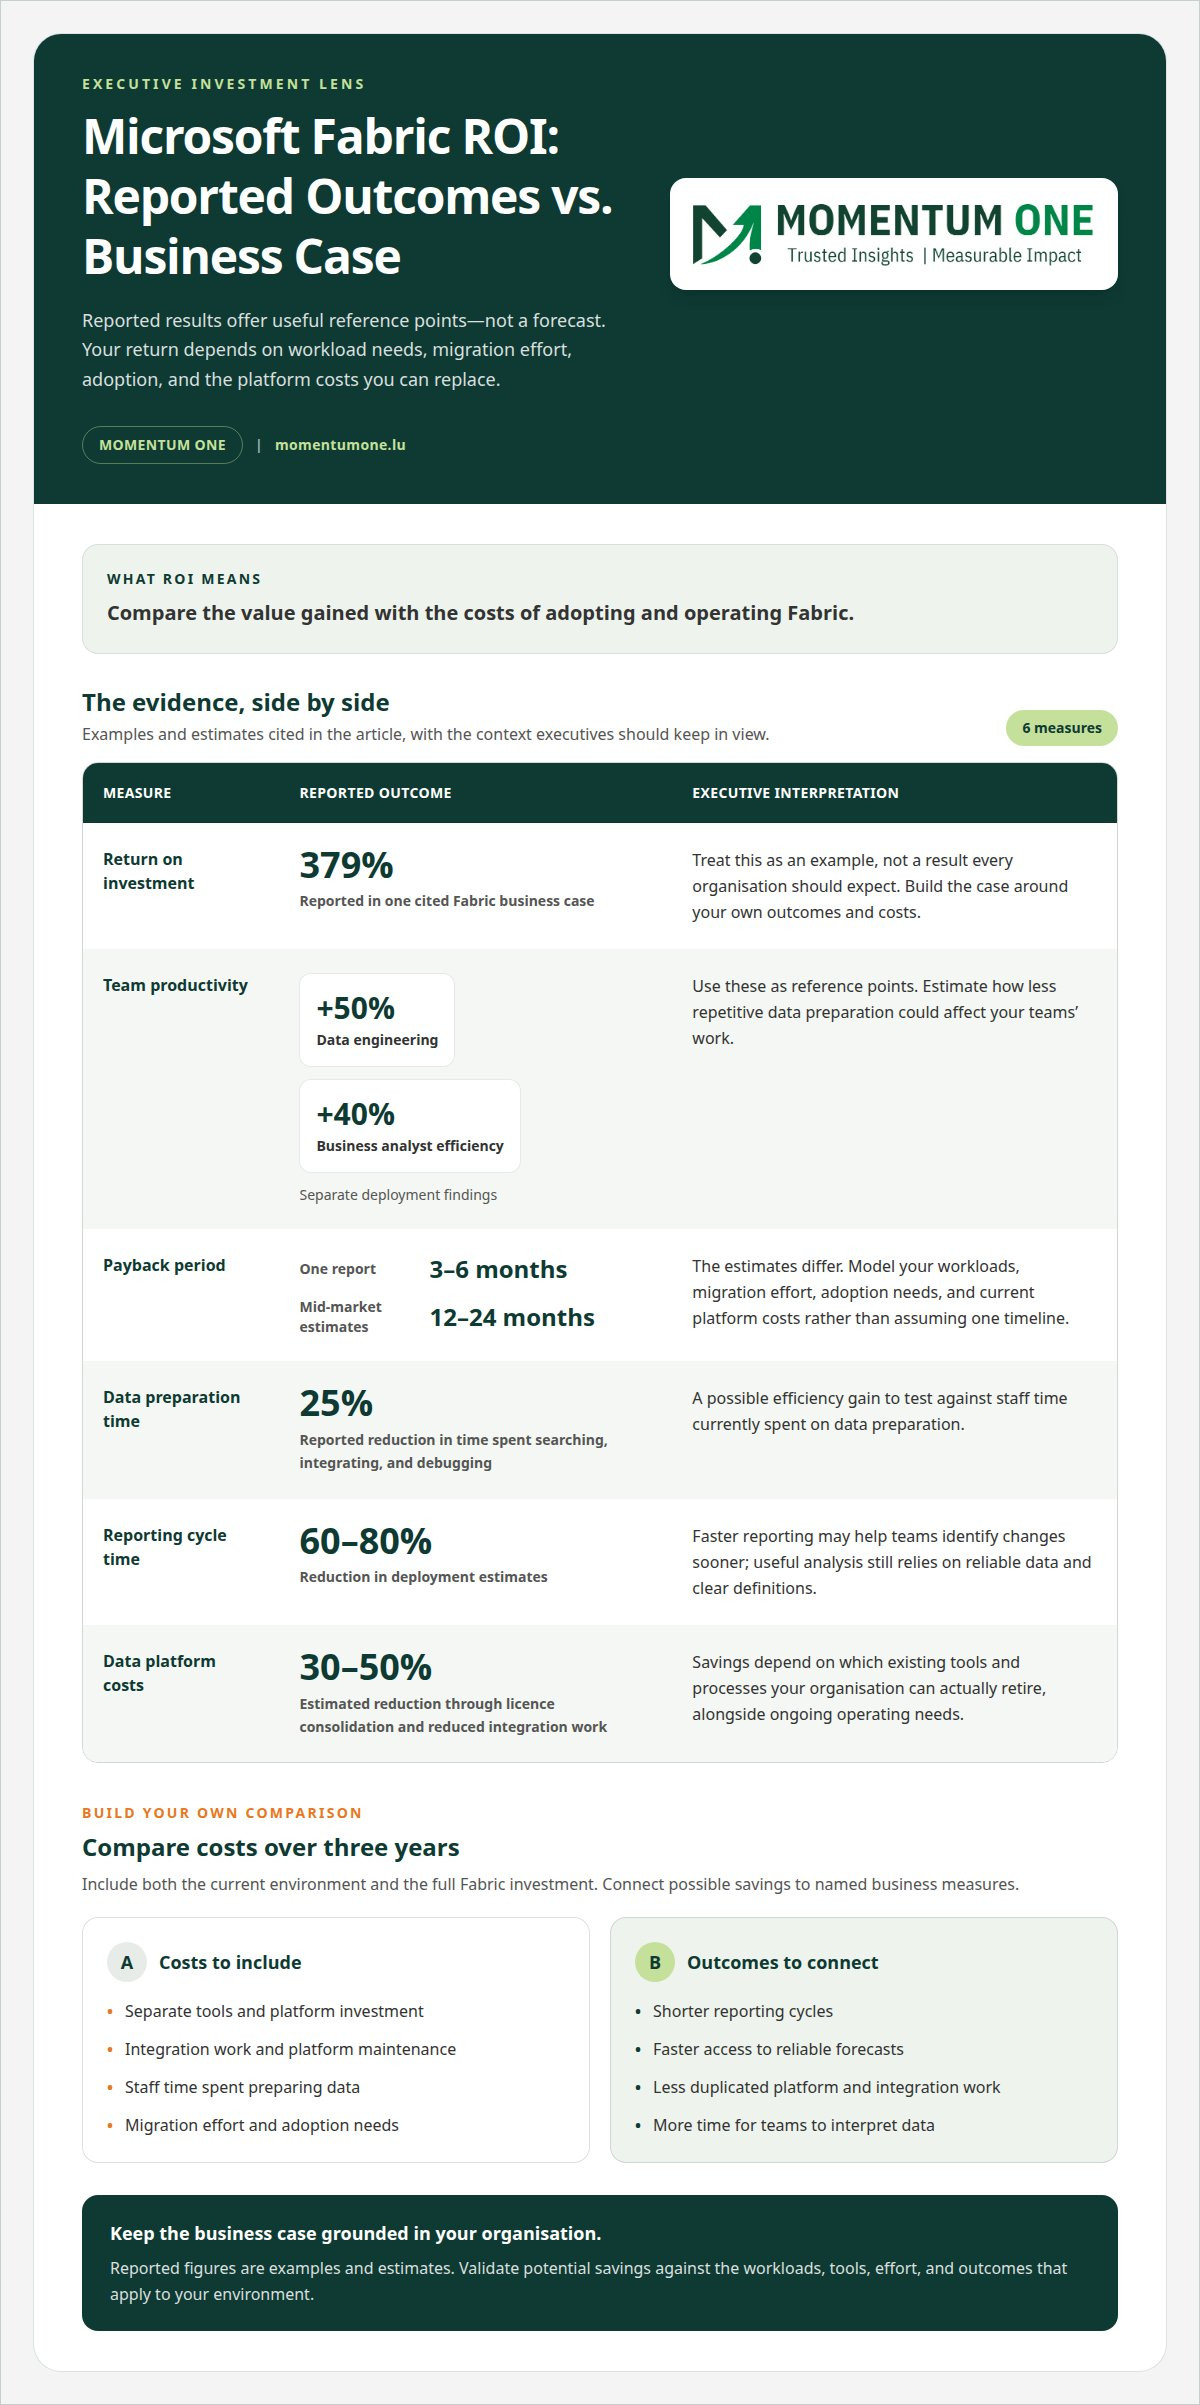
Return on investment compares the value gained with the costs of adopting and operating Fabric. It matters because a platform’s business case depends on outcomes, not capacity alone. One cited Fabric business case reports a 379% return on investment, while separate deployment findings report a 50% increase in data engineering productivity and a 40% improvement in business analyst efficiency.
These figures are examples, not a forecast for every organisation. Payback estimates vary: one deployment report found positive ROI within three to six months, while mid-market implementation estimates place payback within twelve to twenty-four months. This difference underlines why executives should model their own workloads, migration effort, adoption needs, and existing platform costs.
Build the financial case by comparing current and future costs over three years. Include separate tools, integration work, platform maintenance, and staff time spent preparing data. Then connect potential savings to named business measures, such as shorter reporting cycles or faster access to reliable forecasts. A reported 25% reduction in time spent searching, integrating, and debugging illustrates one possible efficiency gain.
Cost consolidation may also contribute: estimates suggest Fabric can reduce total data platform costs by 30-50% through licence consolidation and reduced integration work. The result depends on which existing tools and processes an organisation can actually retire. A Fabric cost optimisation strategy helps frame those savings against continuing operating needs.
Benefits for executives and business users
Fabric’s business benefit is making trusted information more accessible for recurring decisions. Executives can use consistent reporting to understand performance, while analysts can spend less time preparing data and more time interpreting it. That shift matters when leaders need timely answers about revenue, margins, forecasts, or delivery risks.
Automated pipelines and self-service analytics can reduce reporting cycle time by 60-80%, according to deployment estimates. Faster reporting can help business users identify changes sooner, but useful analysis still depends on reliable data and clear definitions. For example, leadership teams need the same meaning for “revenue” across finance reports and Power BI dashboards.
Potential gains include fewer manual handoffs, less repeated integration work, and quicker analysis across workloads. Assess each benefit against a baseline, such as analyst time spent preparing a monthly report. To shape an ROI case around your organisation’s workloads, discuss your Fabric objectives.
Capacity-based pricing and licensing
For executives assessing what Microsoft Fabric is for, capacity and licensing shape the investment decision. Fabric pricing is based on capacity, so the selected tier should match the workloads it supports. In Luxembourg, Fabric is delivered as software as a service and can be used without an Azure account. The approximate monthly prices below offer a planning reference, not a complete estimate of total costs.
Fabric capacity is measured in Capacity Units (CUs). An F2 capacity includes 2 Capacity Units and is a development or proof-of-concept tier. Approximate monthly prices include:
These tiers show how capacity pricing scales. An F8 estimate is higher than F2, while F32 and F64 provide larger capacity options. The suitable tier depends on workload compute requirements, data volume, and expected demand. A Fabric capacity-sizing guide can help frame the decision against expected usage.
Capacity is only one part of licensing. Power BI licensing may also matter for people who create, share, or consume reports. When considering what Microsoft Fabric is for, distinguish the capacity needed to run Fabric workloads from the licensing relevant to Power BI users. Plan applicable licensing costs separately for Luxembourg, rather than treating capacity as the entire analytics budget.
For a practical estimate, separate planned Fabric capacity from user licensing, then map each cost to a workload and user group. For example, a proof of concept might use F2, while a broader reporting rollout could require a different tier. Existing tools, usage patterns, and data connections also shape the full platform budget. A single capacity figure should not be mistaken for the total cost of analytics.
Organisations in Luxembourg should consider availability and pricing alongside data governance, access, privacy, and compliance requirements. Fabric provides centralized governance and access-control capabilities across workloads, while organisations remain responsible for defining ownership and policies. Before expanding the platform, identify the data involved, who needs access, and which governance rules apply. This makes capacity selection part of an operating plan, not just a monthly price comparison.
A further budgeting consideration is whether existing licences can be consolidated. Licence consolidation can reduce data platform spending by 20-40% for organisations adopting Microsoft Fabric, and licence consolidation alone can justify the Microsoft Fabric migration cost for most mid-market organisations within twelve to eighteen months. These estimates can help executives assess the broader case for migration alongside capacity charges, while keeping expected savings distinct from guaranteed outcomes. These figures provide additional pricing reference points, but regional availability and the reservation basis matter when interpreting them alongside Luxembourg estimates.
The intended reporting use also affects which capacity and user licences belong in a plan. An executive dashboard may include plan versus actual, revenue movement, gross margin, pipeline quality, forecast confidence, delivery capacity, open risks, and cash signals. Map these measures to the people who prepare, share, and consume reports to clarify where Power BI licensing applies and where Fabric capacity supports the underlying workloads. Consider whether the reporting environment consolidates tools and licences, and test any expected savings against actual workloads and user needs. This keeps the investment case connected to operational reporting rather than a capacity price in isolation.
Fabric capacity and implementation costs
Evaluate Microsoft Fabric through a focused workload, a capacity estimate, and a practical implementation plan. Start with a reporting problem or migration, then assess how OneLake, existing data sources, engineering effort, and user readiness affect the scope.
Capacity is an ongoing platform cost, while implementation requires time for architecture, migration, testing, governance, and adoption. The right size depends on data volume, workload intensity, concurrency, and operating patterns, not simply the size of the organisation.
Implementation duration also varies with the starting point. A foundational Fabric implementation typically takes three to six months. A full migration from a complex existing estate can take twelve to eighteen months. These timelines reflect different scopes: a contained analytics use case is not equivalent to replacing interconnected warehouses, pipelines, and reporting systems.
To evaluate the investment, organisations can:
- Choose a high-value workload, such as a recurring report or a data engineering bottleneck.
- Map its sources, transformations, users, security needs, and refresh expectations.
- Estimate the Fabric capacity needed for development, testing, and operational use.
- Include migration, data modelling, training, governance, and ongoing administration in the plan.
- Measure outcomes against a baseline, such as report preparation effort or time to deliver analysis.
This sequence keeps a proof of concept tied to a business decision. For example, a finance reporting pilot can test source connections, OneLake design, and semantic model performance before other departments join. Microsoft Copilot may assist with queries or code, but teams still need to validate outputs and establish dependable data definitions.
Implementation costs depend on the amount of source data, the complexity of transformations, and how much of the existing architecture needs redesign. A simple workload with accessible data requires a different level of engineering from a migration involving multiple legacy systems. Training and operational ownership also affect the resources needed after launch. Treat these as scope drivers rather than assuming capacity alone represents the full investment.
A partner can help assess migration scope, modernise data architecture, and plan the transition around business priorities. A Fabric implementation roadmap can structure decisions from the initial use case through expansion. For organisations moving from an established data estate, the key is to sequence workloads so teams can learn from each release and manage operational change.
These figures help frame the trade-off between commitment and flexibility. Validate the appropriate configuration against actual usage before forecasting.
Organizations deploying Microsoft Fabric reported $1.1 million in costs removed by retiring redundant solutions. Include potential savings from retiring overlapping tools in the business case, while confirming which solutions can actually be removed and when those savings would be realised.
Why Fabric adoption needs executive sponsorship
Microsoft Fabric adoption involves business priorities, data architecture, governance, and change, not technology alone. Key challenges include unclear ownership, inconsistent definitions, skills gaps, and workloads without agreed priorities.
Leadership support for adoption
Executive sponsorship means an influential leader sets direction and backs the people and decisions needed to adopt Fabric. It matters because teams across IT and business units must align on data priorities, ownership, and investment. At maturity level 300, a sponsor is identified and expectations are clear. At level 400, that sponsor has cross-organisational authority and productive partnerships with business units, IT, and the Center of Excellence.
Leadership should connect Fabric’s architecture to strategic goals, then allocate staff and remove organisational barriers. For example, a finance leader sponsoring a shared warehouse can bring finance and IT together around consistent definitions for margin and forecast. The sponsor also makes escalated governance decisions when teams disagree about access, ownership, or data quality.
Maturity level 100 describes an organisation where an executive may recognise analytics’ strategic importance but lacks an identified sponsor. At level 500, the sponsor actively drives the data culture vision and tracks goals through KPIs or OKRs. Documenting responsibilities and time commitments helps turn sponsorship into ongoing action. A backup sponsor can maintain decisions when the primary sponsor is unavailable.
Adoption risks and limitations
Adoption risks are organisational and technical issues that prevent Fabric workloads from delivering trusted insights. They matter because a unified platform cannot resolve conflicting metric definitions or unclear data ownership by itself. Without governance, teams may build separate models for the same measure, undermining consistent reporting across a warehouse and business units.
Other challenges include underestimating engineering effort, choosing workloads without clear business value, or treating development as the entire programme. A data pipeline may run successfully while users still rely on familiar spreadsheets because training and change support were overlooked. Copilot can assist with queries and code, but teams must still validate outputs and apply sound data practices.
Executives can reduce these risks by funding a defined use case, naming accountable owners, and agreeing on success measures before implementation expands. For instance, a leadership team could prioritise a recurring forecast, assign ownership of its core models, and review adoption and data quality together. This creates a practical basis for deciding whether to extend the architecture to other workloads.
Strong sponsorship also means making trade-offs visible: which workloads come first, which teams provide expertise, and which governance decisions need executive authority. Discuss executive sponsorship for your Fabric adoption to align priorities, ownership, and the implementation approach.
Momentum One: Fabric Migration & Modernization
Momentum One helps organisations plan and deliver Fabric migration and modernization when existing data platforms need a clearer path forward. The work can include shaping a migration approach, modernising data architecture, and aligning Fabric workloads with business priorities.
For teams building on Fabric, Data Warehouse & Lakehouse Design can establish a suitable foundation, while Data Modeling & DAX Optimization supports reliable measures and reporting. Momentum One’s training solutions help administrators and users develop the skills needed to work effectively with the platform.
If you’re weighing a migration, refining your data architecture, or preparing teams for adoption, contact Momentum One to discuss your goals and next steps.
Turn your Fabric decision into a clear next step
Understanding what Microsoft Fabric is for executives starts with the business decisions you want better data to support. Turn that ambition into a manageable plan: define the outcome, assign ownership, and agree how teams will measure progress. A focused start gives leaders a practical way to learn, adjust priorities, and build adoption around real work.
Momentum One can support that work through Power BI Consulting & Governance, Fabric Migration & Modernization, and Data Modeling & DAX Optimization. These services help align governance, migration choices, and trusted business measures with organisational goals. The right starting point depends on where your current data environment creates friction and which decisions need stronger support.
Bring your priorities, current challenges, and desired outcomes into the conversation. Explore your Fabric next steps with Momentum One, and move forward with a plan grounded in your organisation’s needs.
Frequently Asked Questions
How does Microsoft Fabric integrate with Microsoft 365, Azure, Power BI, and Microsoft Purview?
Fabric connects analytics with Microsoft 365, Azure, and Power BI, while Microsoft Purview should be considered in the organisation’s governance design. Teams can share insights, Excel supports data analysis, and OneLake is built on Azure Data Lake Storage Gen2. Power BI provides reporting within the wider Fabric environment. For Purview, define how governance responsibilities, data ownership, and access policies align with Fabric’s own governance controls.