Troubleshooting Slow Power BI Performance: A Practical Guide
Master troubleshooting slow Power BI performance. Learn how to isolate bottlenecks, leverage Performance Analyzer, and optimize DAX calculations step by step.
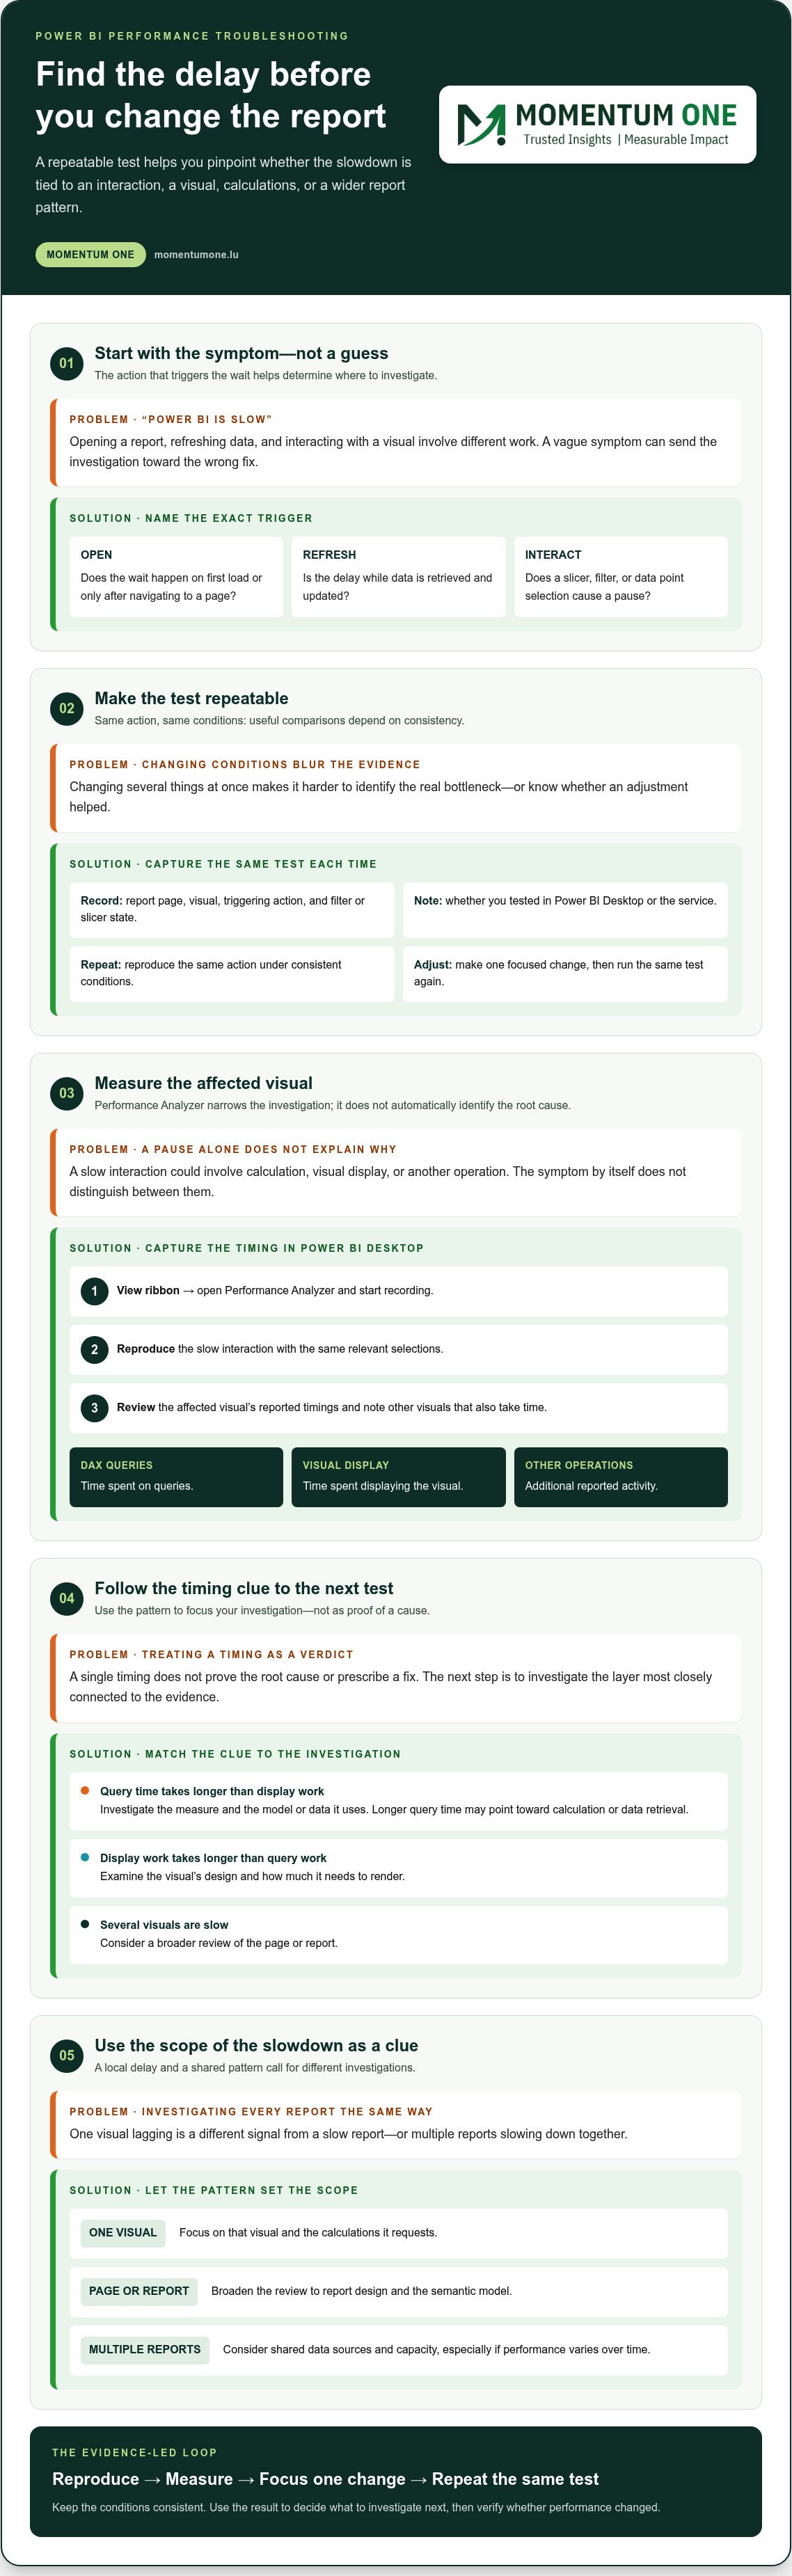
- Start with the exact action that feels slow, then reproduce it under consistent conditions so you can make useful comparisons.
- Use Performance Analyzer timings to narrow down whether a delay is linked to a visual, a model calculation, or another part of the report.
- Look for patterns when troubleshooting slow Power BI performance. A single slow visual calls for a different investigation than delays across a report or at particular times.
- Separate data retrieval delays from report rendering and model calculation when checking data sources, gateways, and capacity.
- Make one evidence-led adjustment at a time, then repeat the same action to see whether performance changes.
What if the slowest part of your Power BI report isn’t the visual you’re watching load? A lagging page, sluggish slicer, or delayed refresh can have different causes. Changing several things at once can make the real bottleneck harder to find. Troubleshooting slow Power BI performance starts with identifying exactly where the delay occurs.
If reports take too long to load or interactions feel unresponsive, you need more than a list of generic optimization tips. This guide shows you how to isolate the issue and distinguish between report rendering, DAX and model performance, data source or gateway delays, and capacity conditions. You’ll then be able to choose a focused next step.
You’ll learn how to use Power BI’s Performance Analyzer to investigate individual visuals and follow the evidence into the semantic model, queries, or Power BI service. You’ll also see when targeted DAX optimization or model improvements may help, and why it’s important to avoid changing multiple layers before you know where the problem lies.
Why is Power BI performance slow? Start with the symptom
A report that takes too long to open, a slicer that pauses before updating, or a refresh that runs inconsistently can disrupt work in different ways. These symptoms are useful clues, but none identifies the cause on its own. The delay may be in report design, the semantic model, a DAX calculation, data retrieval, or the capacity serving the report.
Performance troubleshooting means isolating which stage in the analytics path is responsible for a delay. Start by describing what feels slow and where it happens. One visual taking time to update is a different signal from every page loading slowly or several reports becoming sluggish together.
Does the delay happen when opening, refreshing, or interacting?
Identify the action that triggers the delay before investigating. Opening a report, refreshing its data, and interacting with a visual involve different work. Treating them as the same problem can send you toward the wrong fix.
- Opening: Note whether the delay occurs when the report first loads or only after you navigate to a particular page.
- Refreshing: Record whether the wait occurs while data is being retrieved and updated, rather than while viewing an already loaded report.
- Interacting: Check whether selecting a slicer, applying a filter, or choosing a data point causes a pause, and whether the delay affects one visual or several.
Also note the scope: one visual, one page, the whole report, or multiple reports. Record the action, page, and whether the issue happens every time or only under certain conditions. This gives you a repeatable test and helps distinguish a local report issue from a broader pattern. Avoid editing the report while you’re still establishing what triggers the delay.
Is Power BI itself the cause of a slow report?
Slowness alone doesn’t prove that Power BI is the source of the problem. A report can feel slow because its visuals require substantial rendering, its model contains inefficient structures, its DAX measures take time to calculate, or its data source is slow to respond. In the Power BI service, capacity conditions may also affect performance. Understanding the Power BI architecture and components can clarify how these parts work together, but the symptom still needs to guide the investigation.
Use the pattern to decide what to examine first. If one visual lags while the rest of the page responds, focus on that visual and the calculations it requests. If a page or report is consistently slow, broaden the investigation to its design and semantic model. If multiple reports slow down together, or performance varies over time, consider shared data sources and capacity rather than changing each report separately.
This is why troubleshooting slow Power BI performance should begin with evidence, not a platform replacement or a batch of unrelated changes. A targeted review of model structure or DAX may be appropriate when findings point there. Semantic model optimization can address issues rooted in how data is organized and served to reports. First classify the symptom, then test the layer most closely connected to it.
How to troubleshoot slow Power BI performance step by step
Once you’ve identified the slow action, investigate it in a controlled sequence. Reproduce the delay, isolate the affected visual or page, measure what Power BI reports, then compare results after a focused change. Keeping the test consistent makes it easier to tell whether an adjustment helped or simply changed the conditions.
Measuring one reproducible interaction is more useful than guessing because it gives you evidence to compare. A slicer that feels slow is a starting clue. Timings for that same slicer action can help narrow down what’s taking time.
- Reproduce the delay. Open the report in Power BI Desktop and repeat the action that triggers the pause.
- Isolate the element. Note the page and visual involved, and keep the relevant filter or slicer selections consistent.
- Measure the activity. Capture the timing for the affected visual and note other visuals that also take time.
- Compare the evidence. Use the results to choose one area to investigate, then repeat the same action after a targeted adjustment.
Use Performance Analyzer to locate a slow visual
In Power BI Desktop, open Performance Analyzer from the View ribbon, start recording, and reproduce the slow interaction. Review the entries for the affected visuals. The tool reports time spent on DAX queries, visual display, and other operations. Longer query time points toward calculation or data retrieval for further investigation. More time spent displaying a visual suggests rendering work may contribute. Neither timing alone proves the root cause.
Treat the capture as a diagnostic clue, not a verdict. If a visual’s query takes longer than its display work, investigate its measure and the model or data it uses. If the query is relatively quick but display work takes longer, examine the visual’s design and how much it needs to render. A page with several slow visuals may need a broader review. Performance Analyzer helps direct your next test, but it doesn’t automatically prescribe a fix.
Build a small, repeatable troubleshooting record
Write down the report page, visual, triggering action, filter state, and timings shown for the visual. Include whether you tested in Desktop or the service so later comparisons use the same environment. After changing one thing, repeat the same interaction with the same selections. This record helps separate a real improvement from a result caused by a different filter or test.
- Page and visual: Identify exactly where the delay appears.
- Action and state: Record the interaction and filters applied.
- Timing and change: Note the captured results and the single adjustment made.
If evidence points to the visual layer, use a Power BI dashboard optimization checklist to guide a structured review of report design. If results suggest several layers are interacting, a focused Power BI performance consultation can help connect the findings to targeted model or DAX improvements.
Which Power BI layer is slowing the report: visuals, model, or DAX?
Performance Analyzer timings help narrow down where time is spent, but the pattern across visuals matters too. A single visual behaving differently from its neighbours may point to report design or a calculation unique to that visual. Similar delays across several visuals can suggest that they share a model or calculation issue. These clues guide the next investigation; they don’t prove a cause by themselves.
Use the comparison below to connect what you observe with a sensible place to look next. When troubleshooting slow Power BI performance, distinguish the report’s display work from the data and calculations that supply it before choosing a change.
| Layer | Clues to look for | Focused next investigation |
|---|---|---|
| Visuals and page design | A particular chart, table, or interaction is slower than others on the same page. | Review the visual’s complexity, the data it displays, and interactions with other page elements. Test one design adjustment and measure the same action again. |
| Semantic model | Several visuals are affected, especially when they rely on related tables, relationships, or shared fields. | Examine model structure and how data is organized and related. Check whether model complexity could be contributing to query work across the report. |
| DAX | Delays appear in visuals that use particular measures, or query timings are elevated for calculations. | Review the measures involved and how their calculations behave in the context of the model and filters. |
When report visuals or page design are the likely bottleneck
Look for a delay tied to one visual or a specific interaction, such as expanding a detailed table or selecting a chart point that filters several other visuals. A page combining many elements or complex interactions may require more display work after a selection. Don’t assume that any particular visual count is automatically too high. Compare measured timings, make one focused design change, and repeat the same interaction to see whether the evidence shifts.
If the issue appears limited to page layout or visual behaviour, inspect report design before starting a semantic model optimization review. A visual-focused review can help identify interactions or elements worth testing without removing useful information by default.
When the semantic model or DAX needs investigation
If several visuals show slow query timings, or the same measures are involved across pages, look beyond the display layer. Model structure affects how report queries navigate and combine data, while DAX defines the calculations those queries must perform. Complex relationships or calculation patterns may contribute to delays, so check whether symptoms cluster around shared tables, measures, or filters. For a deeper look at calculation-level improvements, see DAX optimization for enterprise performance.
How capacity, data sources, and gateways affect Power BI performance
If one visual is slow while the rest of the report responds normally, shared infrastructure may not be the first place to look. A broader pattern is more informative: several reports slowing together, multiple users reporting delays, or performance changing at particular times can point to dependencies beyond an individual page. These clues don’t confirm a capacity or source issue, but they help you decide what evidence to gather next.
Separate three kinds of work. Data retrieval is the time taken to get data from a source, including through a gateway when one is used. Model calculation is the processing needed to answer report queries. Visual rendering is the work of displaying results on the page. A slow refresh or delayed data response calls for a different investigation than a visual that takes time to render after its query completes.
When to investigate capacity behavior
Consider capacity when delays affect multiple reports or users sharing the same environment, particularly if timing varies. Compare capacity monitoring information with representative report use, noting whether slow periods coincide with other workloads or recurring demand. A capacity adjustment may be appropriate if evidence points to shared resource pressure, but it shouldn’t be the automatic first response to one sluggish report or visual.
Look for patterns rather than treating one slow session as proof. If a report is responsive at some times and slow at others, compare those sessions with available capacity activity and workload conditions. For a deeper review of how shared capacity relates to performance and workload, use this Power BI capacity management guidance.
When data sources or an on-premises gateway may be involved
Check whether the delay clusters around refreshes or actions that need data retrieval. If a report opens quickly but refresh activity takes longer, investigate the source and the route used to reach it. For gateway-connected sources, assess gateway performance as its own layer. A slow interaction alone doesn’t establish a source problem, since calculations and visual rendering can still take time after data is available.
Use these comparisons to narrow the investigation:
- Refresh or retrieval is slow: Focus on source response and, if applicable, the gateway path.
- Several users or reports slow together: Compare the timing with shared capacity activity and other workloads.
- Only one visual is slow: Keep the investigation focused on that report element and its calculations before expanding to infrastructure.
When troubleshooting slow Power BI performance, preserve the same report action and conditions as you compare findings. If evidence points to interacting capacity, source, and model factors, discuss a focused Power BI performance review to connect the signals to a practical next step.
How to fix slow Power BI reports and verify the improvement
Choose a change that matches what your measurements indicate. If timings suggest a particular visual is doing extra display work, review that visual before changing the model. If several visuals share slow calculations, investigate the relevant measures or semantic model. If delays affect users across reports at particular times, consider shared capacity or data retrieval. Changing several layers at once can make it harder to tell what helped.
Keep each investigation focused: make one targeted adjustment, then repeat the original report action under comparable conditions. A useful test holds the page, visual, filter selections, environment, and user action steady. If you change a measure and a slicer’s selections at the same time, a timing difference won’t tell you which change mattered.
Validate each change instead of relying on impressions
Use the same interaction you recorded during the initial diagnosis. Capture Performance Analyzer output before and after the adjustment, comparing the relevant query and display timings. Check the rest of the page too: a faster visual is useful only if the delay hasn’t shifted to another element or interaction. If the result is unclear, return to the original conditions and repeat the comparison before making another change.
Document the work in a simple record so the team can build on the evidence instead of starting over:
- Symptom: What action was slow, and where did it occur?
- Finding: Which visual, query, calculation, model area, or shared condition appeared relevant?
- Change: What single adjustment did you make?
- Result: What changed in the same test, including any new delay elsewhere?
This validation loop turns troubleshooting slow Power BI performance into a repeatable process. It also gives colleagues a clear basis for deciding whether to keep the adjustment, investigate further, or restore the previous version.
When Power BI performance consulting can help
Some issues don’t sit neatly in one layer. A DAX measure may interact with model structure, while report design and shared capacity also shape the user experience. When evidence points to connected causes, isolated changes can miss the underlying relationship. Momentum One provides Power BI consulting, governance, data modeling, and DAX optimization to help investigate slow reports and complex models through a focused, connected review.
This support can be useful when findings are difficult to interpret or a change in one area affects another. The aim is to connect the evidence to a practical next step, whether that means refining calculations, improving the semantic model, or examining broader performance conditions. To discuss a Power BI performance challenge, talk with Momentum One.
Turn performance findings into a lasting improvement
Make performance checks part of how your team maintains reports, not just a response to a frustrating slowdown. Keep a record of conditions that matter to users and the results of your tests. That baseline can help you spot when a future change affects responsiveness and prioritize work based on evidence.
Not every delay needs a broad redesign. A clear finding can point to a focused adjustment, while overlapping causes may call for a wider review. The value of troubleshooting slow Power BI performance is not only a faster report; it’s also a clearer understanding of what supports reliable reporting as your data and requirements evolve.
Ready to turn your findings into a practical plan? Start a conversation with Momentum One about your Power BI performance goals. A clear, evidence-led approach can help your team build Power BI reporting it can trust and manage.
Frequently Asked Questions
Does the delay happen when opening, refreshing, or interacting?
Identify the action that triggers the delay before investigating. Opening a report, refreshing its data, and interacting with a visual involve different work. Treating them as the same problem can send you toward the wrong fix. Also note the scope: one visual, one page, the whole report, or multiple reports. Record the action, page, and whether the issue happens every time or only under certain conditions. This gives you a repeatable test and helps distinguish a local report issue from a broader pattern. Avoid editing the report while you’re still establishing what triggers the delay.
Is Power BI itself the cause of a slow report?
Slowness alone doesn’t prove that Power BI is the source of the problem. A report can feel slow because its visuals require substantial rendering, its model contains inefficient structures, its DAX measures take time to calculate, or its data source is slow to respond. In the Power BI service, capacity conditions may also affect performance. Understanding the Power BI architecture and components can clarify how these parts work together, but the symptom still needs to guide the investigation. Use the pattern to decide what to examine first. If one visual lags while the rest of the page responds, focus on that visual and the calculations it requests. If a page or report is consistently slow, broaden the investigation to its design and semantic model. If multiple reports slow down together, or performance varies over time, consider shared data sources and capacity rather than changing each report separately. This is why troubleshooting slow Power BI performance should begin with evidence, not a platform replacement or a batch of unrelated changes. A targeted review of model structure or DAX may be appropriate when findings point there. Semantic model optimization can address issues rooted in how data is organized and served to reports. First classify the symptom, then test the layer most closely connected to it. Once you’ve identified the slow action, investigate it in a controlled sequence. Reproduce the delay, isolate the affected visual or page, measure what Power BI reports, then compare results after a focused change. Keeping the test consistent makes it easier to tell whether an adjustment helped or simply changed the conditions. Measuring one reproducible interaction is more useful than guessing because it gives you evidence to compare. A slicer that feels slow is a starting clue. Timings for that same slicer action can help narrow down what’s taking time.
Is Power BI Desktop performance different from Power BI Service performance?
Yes, the same report action can behave differently in Desktop and the Power BI service because they run in different environments. Compare one action, such as opening a page or applying a slicer, in both places and record where the wait occurs. A difference doesn’t identify the cause by itself. Use it as a clue, then review report, model, source, and capacity evidence before choosing what to change.
Can one slow visual make an entire Power BI report feel slow?
Yes. A visual that takes longer to query or display can make its page feel unresponsive, even if other visuals continue to work normally. For example, a table may lag while a nearby card updates quickly. Isolate the table in Performance Analyzer and repeat the same interaction to compare timings. One slow visual is a useful clue, not proof that the whole semantic model is responsible.
How do I find which visual is slowing down a Power BI report?
Use Power BI Desktop’s Performance Analyzer while repeating the action that causes the delay, then compare the entries for report elements. Note the page, visual, action, and filter state so you can identify the conditions behind each result. Query and rendering timings help point to what to investigate, but they aren’t a complete explanation on their own. This evidence-led approach supports troubleshooting slow Power BI performance without relying on guesswork.
What happens if a Power BI report is slow only during certain times?
Time-specific delays can justify checking whether other reports or users experience the same slowdown. Record when it happens, then compare the same report action during an affected and an unaffected period. Review available capacity activity and data-source behaviour around those times, but don’t assume either is responsible without supporting evidence. If only one report is affected, keep its design and model in scope alongside shared environment factors.
Is a slow Power BI data refresh the same problem as a slow report?
No. Refresh time measures how long updating data takes, while report responsiveness concerns opening a report or interacting with its visuals. These operations can involve different parts of the environment, so record them separately. For example, note whether an existing report responds quickly while refresh is delayed, or whether both operations are slow. Identifying the affected operation first helps you choose a relevant diagnostic path instead of changing report design prematurely.
Can changing the report design fix slow Power BI performance?
It can help if measurements point to a particular visual or page interaction, such as a complex chart that takes longer to display. But a design adjustment won’t necessarily address a slow model calculation, source, gateway, or capacity issue. Measure the affected action, make one relevant change, and retest with comparable filters and conditions. Treat the result as evidence, not a promise that a design change will resolve every delay.
What information should I collect before asking for Power BI performance help?
Prepare a concise record of the affected report page and visual, the action that triggers the delay, the filters applied, and when it occurs. Include any Performance Analyzer findings, whether other reports are affected, and whether refresh is also slow. Note where you observed the issue, such as Desktop or the service. A repeatable description gives a team a useful starting point for investigating the cause.