Power BI vs Tableau: The Best Choice for Enterprises
Choosing Power BI vs Tableau for enterprise? Our 2026 guide compares data lakehouse integration, Microsoft Fabric, AI features, and total cost of ownership.
- Learn why modern BI strategy has evolved from simple visualization to a "Unified Data Lakehouse" model that prioritizes architectural synergy.
- Evaluate Power BI vs Tableau for enterprise performance by understanding how calculation engines like VertiPaq and Hyper handle multi-billion row datasets.
- Discover how Microsoft Fabric and the OneLake concept eliminate persistent data silos to create a single source of truth for your organization.
- Identify the specific ecosystem advantages and automated pipeline requirements that make Power BI the logical choice for Microsoft-centric environments.
- Gain a structured framework for de-risking your platform migration through comprehensive technical audits and certified partner support.
If you're still choosing a BI tool based solely on how the charts look, you might be overlooking the most critical infrastructure shift of the decade. In 2026, the Power BI vs Tableau for enterprise debate has moved beyond simple aesthetics to focus on which platform acts as the nerve center for your data lakehouse. You've likely experienced the frustration of soaring licensing costs for disjointed tools or the governance headaches that come with fragmented data silos. It's a common challenge for organizations trying to maintain performance across massive, complex datasets.
We understand that choosing the wrong path now can lead to years of technical debt. This expert comparison provides a clear roadmap for platform consolidation, specifically focusing on how Microsoft Fabric integration impacts your bottom line. We'll examine the latest August 2026 updates, including Power BI's advanced Copilot features and Tableau's Einstein AI enhancements. By the end of this guide, you'll know exactly how to align your BI strategy with national security governance standards while ensuring your data environment remains scalable and cost-effective.
Enterprise BI in 2026: Beyond the Visualization Debate
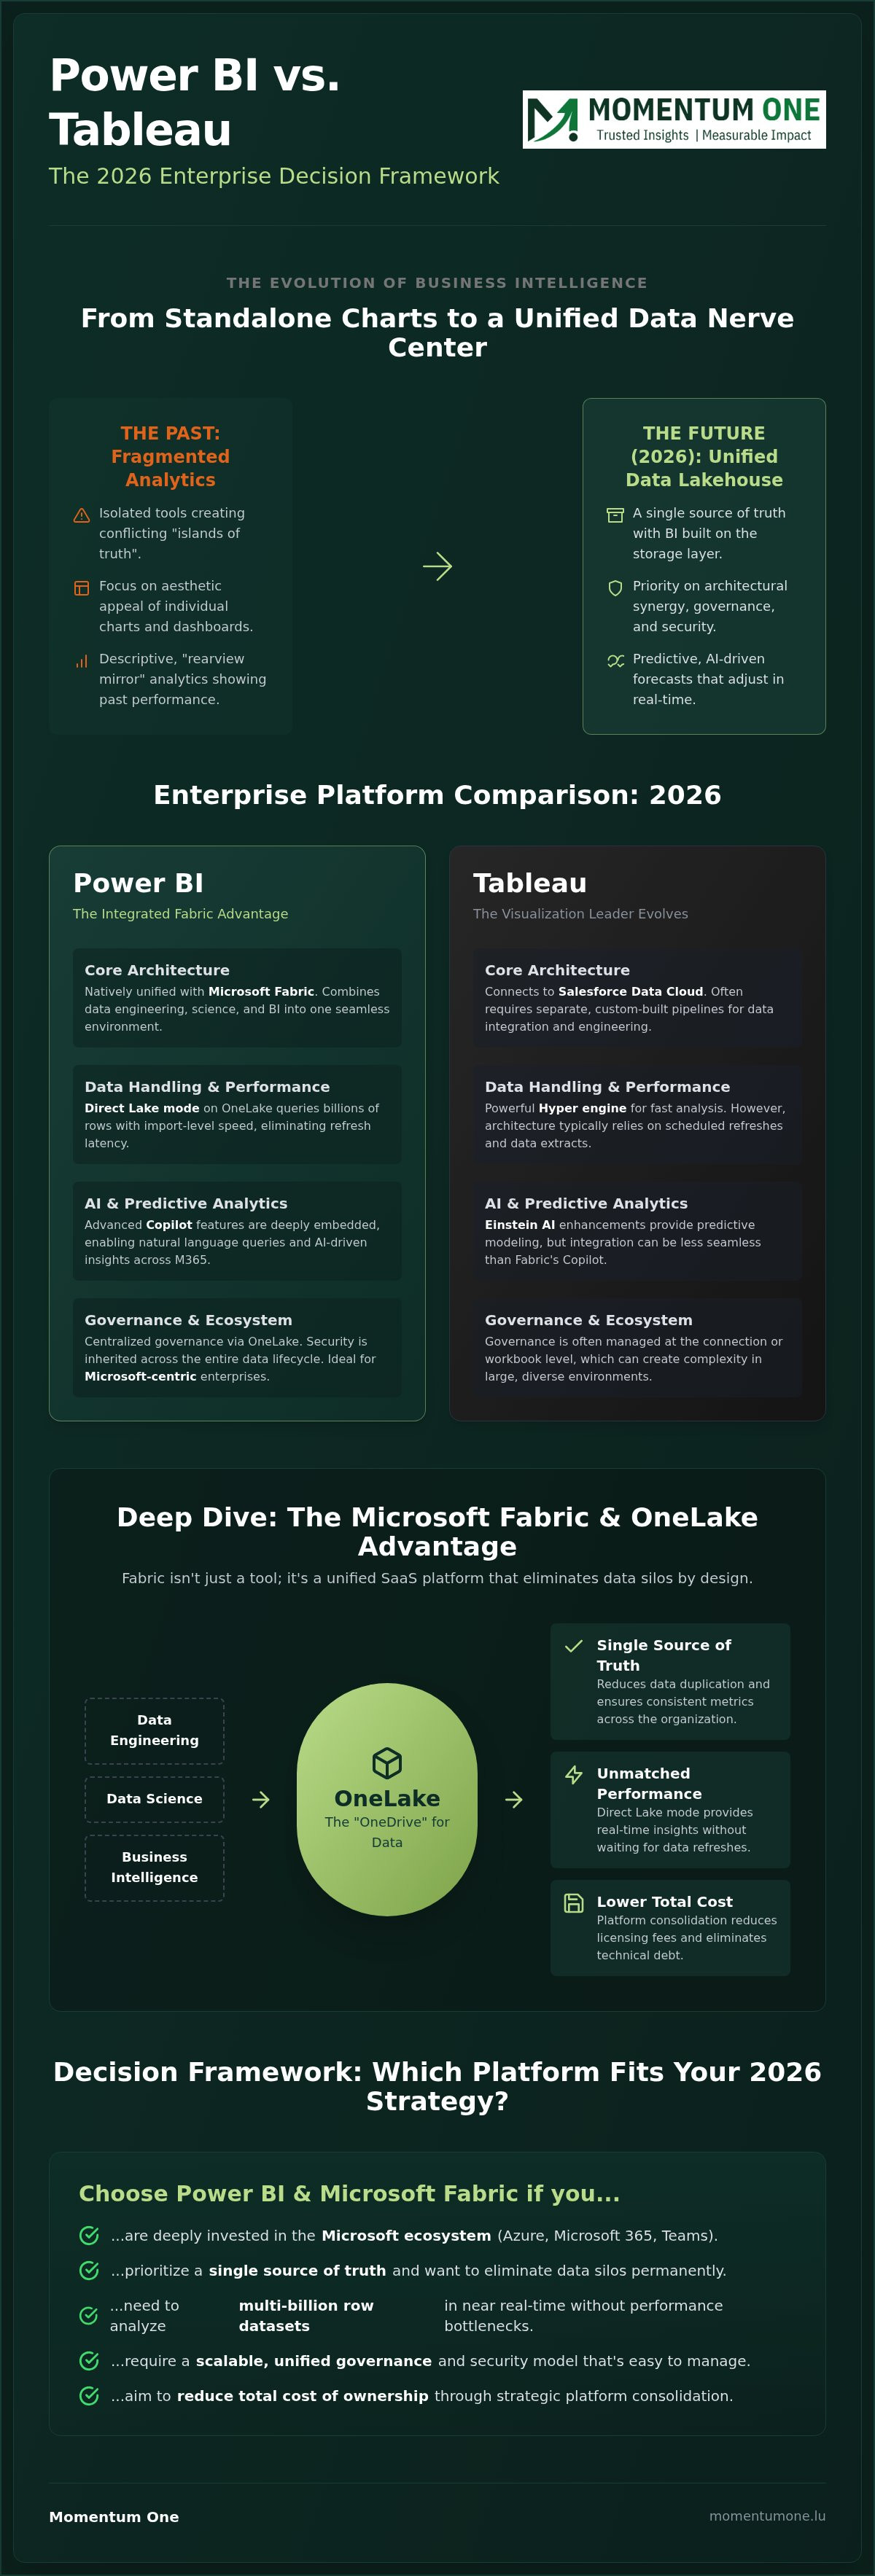
The era of choosing a platform based on font choices and color palettes is over. As we look at the 2026 landscape, the choice between Power BI vs Tableau for enterprise environments is dictated by architectural synergy. Large organizations are moving away from isolated reporting tools that create "islands of truth." Instead, they're adopting the Unified Data Lakehouse model as the new corporate standard. This approach treats data as a shared asset rather than a series of disconnected files, ensuring that your analytics layer sits directly on top of your storage layer without redundant data movement.
National data residency requirements have also become a non-negotiable factor in this decision. For enterprises operating in regulated markets, the ability to ensure data stays within specific geographic boundaries is paramount. This shifts the focus from front-end features to back-end compliance and cloud infrastructure stability. We're seeing a massive trend toward BI platform consolidation because managing multiple vendors often leads to governance nightmares and security gaps that modern enterprises can't afford to ignore.
The Shift from Descriptive to Predictive Analytics
Dashboards used to be about looking in the rearview mirror. Now, Business intelligence (BI) is increasingly defined by its ability to look forward. Enterprises don't just want to see last month's sales; they want AI-driven forecasts that adjust in real time. Tools like Copilot and integrated AI assistants are no longer optional extras. They're essential components of the modern workflow. This trend favors platforms that integrate deeply with existing AI ecosystems rather than standalone tools that require complex, custom-built bridges. It's about empowering every user to ask natural language questions and receive predictive insights instantly.
Fragmented Data vs. Single Source of Truth
Tool sprawl is an expensive burden that slows down decision-making. When different departments use different BI platforms, you end up with duplicated pipelines and conflicting metrics. This fragmentation creates significant operational risk. Establishing a Single Source of Truth is the primary goal for 2026 enterprise data strategies. It ensures that whether a CEO looks at a high-level report or an analyst dives into a data lakehouse, the numbers match perfectly. Consolidation isn't just about saving on licensing costs; it's about reducing the "trust tax" paid when employees spend hours arguing over which report is actually correct. By unifying your environment, you create a steady foundation for growth and innovation.
The Microsoft Fabric Factor: Power BIs Unfair Advantage
Microsoft Fabric has fundamentally changed the conversation about Power BI vs Tableau for enterprise deployments. It isn't just a rebranding of existing tools; it's a unified platform that binds data engineering, data science, and business intelligence into a single environment. At the heart of this is "OneLake," often described as the OneDrive for data. This unified storage layer eliminates the need for complex, fragile pipelines between different tools. Instead of moving data to your reports, your reports live directly on your data. This architectural shift provides a level of real-time analytics that standalone Tableau setups struggle to match.
By leveraging Direct Lake mode, Power BI can query massive datasets in OneLake with the speed of an in-memory import but without the latency of a scheduled refresh. This means your enterprise can act on data that's minutes old, not yesterday's batch. When you combine this with the natural integration into the Microsoft 365 ecosystem, the result is a seamless flow of information. Your teams don't need to leave Teams or Excel to find the insights they need, which significantly boosts adoption rates across the organization.
Architecting for the Future with Fabric
Moving toward this model often involves a Fabric Migration to modernize legacy reporting structures. This transition replaces fragmented workspaces with a governed, scalable environment where security settings are inherited across the entire data lifecycle. Governance at scale becomes manageable because you're applying rules at the storage level rather than per dashboard. It's a cleaner, more resilient way to handle multi-billion row datasets without hitting the performance bottlenecks common in traditional BI setups.
Tableaus Response: Salesforce Data Cloud
Tableau has attempted to counter this through Salesforce Data Cloud integration. While this provides deep value for Salesforce-heavy organizations, it often introduces multi-cloud complexity for the rest of the enterprise. Managing governance across separate clouds creates friction that native ecosystem integrations simply don't have. Independent BI tools like Tableau are finding it increasingly difficult to match the performance and cost-efficiency of a platform where the storage and visualization layers are built to be one. For leaders evaluating Power BI vs Tableau for enterprise use, the decision often comes down to this ecosystem synergy. If you're looking to simplify your architecture, exploring how a partner-led modernization can streamline your data flow is a logical next step.
Technical Deep-Dive: Scalability, DAX, and Performance
Power BI and Tableau rely on distinct calculation engines that define how they handle massive datasets. Power BI uses the VertiPaq engine, a highly compressed, in-memory columnar database. Tableau utilizes Hyper, which is also optimized for high-performance data processing. While some legacy reviews suggest Tableau holds a slight edge in raw visual exploration, the modern reality of Power BI vs Tableau for enterprise performance depends heavily on model efficiency. Power BI's ability to handle multi-billion row datasets in 2026 is largely a result of sophisticated DAX Optimization. Without these refinements, even the most robust Premium capacity can suffer from latency.
The learning curve for these platforms also differs significantly. Power BI utilizes DAX (Data Analysis Expressions), which feels familiar to Excel users but requires a deep understanding of filter context for complex logic. Tableau uses VizQL, a visual-logic approach that translates drag-and-drop actions into data queries. For corporate environments where data logic is often intricate, the flexibility of DAX allows for more precise control over business calculations. It's the difference between a tool that's easy to start with and one that's powerful enough to finish the job at scale.
Advanced Data Modeling for Corporate BI
Building a resilient report starts with a solid foundation. We advocate for the star schema over flat tables to ensure optimal performance and lower memory consumption. Professional DAX troubleshooting often reveals that performance bottlenecks aren't caused by data volume, but by inefficient relationships or overly complex measures. A robust Data Warehouse Design ensures that your BI layer doesn't have to perform heavy lifting that should have happened during the ETL process. This structural clarity is what allows reports to remain snappy even as your data grows.
Governance and Security at the Enterprise Level
Security is a primary concern for any national corporate entity. Power BI offers granular control through Row-Level Security (RLS) and Object-Level Security (OLS), allowing you to restrict data access based on user roles. While Tableau also provides robust security features, Power BI's integration with Entra ID (formerly Azure AD) simplifies tenant administration. We help organizations automate these access controls to ensure that sensitive information is only visible to authorized personnel. This approach maintains compliance with national security standards without the burden of manual overhead.
Decision Framework: Which Platform Fits Your 2026 Strategy?
Strategic alignment is the deciding factor in the Power BI vs Tableau for enterprise debate. If your organization is already operating within the Microsoft 365 or Azure ecosystem, Power BI offers a friction-free experience. It allows you to leverage Automated Data Pipelines to streamline ingestion and transformation. This synergy reduces the time spent on technical plumbing. It ensures that your data flows directly from source to report without the need for complex, third-party middleware.
Tableau remains a strong contender for organizations that prioritize highly creative, exploratory data storytelling. If your analysts require complete artistic freedom or if your enterprise is deeply embedded in the Salesforce ecosystem with no plans for a Microsoft 365 roadmap, Tableau's visual flexibility is still a benchmark. However, for most corporate use cases, the functional benefits of an integrated stack often outweigh the aesthetic edge of a standalone tool. The goal is to build a steady, reliable environment where insights are accessible to everyone, not just a few power users.
Calculating Total Cost of Ownership (TCO)
When calculating the TCO of Power BI vs Tableau for enterprise use, look beyond the initial license fee. As of August 2026, Power BI Pro sits at $14 per user/month. Many enterprises find this cost is already covered through their Microsoft 365 E5 subscriptions. Tableau represents a different financial commitment. An Enterprise Creator seat costs $115 per user/month, billed annually. You must also account for hidden costs. These include separate server maintenance and the training required to bridge two different software environments. Consolidating on a single platform often yields a higher ROI. It simplifies your vendor landscape while reducing the "complexity tax" of managing multiple data silos.
The Skills Gap: Training and Adoption
Adoption is the ultimate metric for BI success. Power BI has a distinct advantage here because it leverages existing Excel skills. Most business users find the transition to Power BI intuitive, which accelerates the rollout process. Investing in Corporate Power BI Training ensures your team moves beyond basic reporting to advanced data modeling. Managing the cultural shift from legacy tools to a modern BI environment requires a steady hand and a clear roadmap. We focus on empowering your staff to take ownership of their data journey, ensuring that the technology actually drives growth.
If you're looking to streamline your analytics and maximize your Microsoft investment, our Power BI Consulting & Governance services can help you build a scalable foundation.
Strategic Implementation: Moving from Evaluation to Execution
Transitioning from evaluation to execution requires more than just a change in software. It demands a structured approach that prioritizes long-term stability over quick wins. A comprehensive technical audit stands as the essential first step in this journey. This process goes beyond looking at report lists; it evaluates the underlying data health, the complexity of existing calculations, and the readiness of your current infrastructure. For organizations weighing Power BI vs Tableau for enterprise deployment, this audit reveals exactly where your technical debt lies. It provides the clarity needed to decide which legacy reports should be migrated and which should be completely rebuilt for better performance.
Working with a certified Microsoft Solutions Partner provides the expertise needed to navigate these complexities. With over 8 years of experience in technical implementations, Momentum One acts as a reliable strategist for your data transformation. We emphasize the creation of a robust governance framework before any scaling occurs. This framework sets the rules for workspace management, data access, and report lifecycle policies. By defining these standards early, you avoid the common pitfalls of tool sprawl and inconsistent metrics. It's about building a steady environment where data is both accessible and secure, reflecting a commitment to operational excellence.
Building a Scalable BI Roadmap
Corporate operations shouldn't stop because of a platform shift. A phased migration strategy allows your enterprise to move from Tableau to Power BI in logical stages, ensuring business continuity. During this transition, we don't just replicate old reports; we optimize them for peak performance and accuracy. This involves refining data models and optimizing DAX logic to suit the VertiPaq engine. To maintain this high standard, we offer Managed BI Services. These services provide continuous monitoring and proactive maintenance, ensuring your environment remains scalable and governed as your data volume increases.
Next Steps for Your Enterprise
The path forward starts with a deep architectural review of your current data stack. This review identifies the best opportunities for Fabric integration and highlights areas where data silos can be permanently eliminated. Once the foundation is set, empowering your staff through technical training is the final piece of the puzzle. We provide the tools and knowledge your team needs to thrive in a modern, Fabric-enabled environment. If you're ready to move from fragmented reporting to a unified analytics nerve center, schedule a strategic consultation with Momentum One. We'll help you navigate the execution phase with confidence and precision.
Future-Proofing Your Enterprise Data Strategy
Choosing between Power BI vs Tableau for enterprise use in 2026 is no longer a simple feature comparison. It's a strategic decision that defines your organization's data architecture for the next decade. We've explored how Microsoft Fabric provides an unmatched synergy for those already in the M365 ecosystem, offering a unified storage layer through OneLake. You've also seen that while Tableau maintains its visual depth, the lower total cost of ownership and seamless integration of Power BI make it the logical choice for scalable, governed analytics.
Success depends on moving from fragmented reporting to a steady, unified environment. As a Certified Microsoft Solutions Partner with extensive national enterprise experience, we specialize in de-risking this transition. Whether you need expert DAX optimization or a complete Fabric migration, we're here to act as your reliable strategist. Don't let technical debt or data silos slow your progress.
Partner with Momentum One for Enterprise BI Strategy and turn your data into a high-performance asset. We look forward to supporting your journey toward a more efficient, insight-driven future.
Frequently Asked Questions
Is Power BI really cheaper than Tableau for large enterprises in 2026?
Yes, Power BI typically offers a lower total cost of ownership due to its integration with Microsoft 365 licensing. As of August 2026, Power BI Pro is $14 per user monthly and is often included at no extra cost for users with E5 licenses. In contrast, Tableau Enterprise Creator seats cost $115 per user monthly, which can lead to significantly higher annual expenditures for large organizations.
Can Power BI handle the same data volume as Tableau?
Power BI is fully capable of managing multi-billion row datasets through its VertiPaq engine and Direct Lake mode. While both platforms offer high-performance calculation engines, the choice between Power BI vs Tableau for enterprise scale often depends on model architecture. With proper optimization, Power BI handles massive data volumes with the same efficiency and speed as any independent BI tool on the market.
What are the main benefits of migrating from Tableau to Microsoft Fabric?
Migrating to Microsoft Fabric eliminates persistent data silos by providing a unified storage layer called OneLake. This environment integrates data engineering, data science, and business intelligence into a single platform. It allows your enterprise to maintain a single source of truth, reducing the operational risks and costs associated with moving data between disconnected tools and multiple cloud providers.
How long does a typical enterprise Power BI migration take?
A typical enterprise migration generally takes between three to nine months depending on the complexity of your data environment. We follow a structured, phased approach that starts with a technical audit and governance setup. This timeline ensures that critical business reporting continues without disruption while we systematically modernize your data models and optimize report performance for the new environment.
Do I need a Microsoft Solutions Partner to implement Power BI governance?
Engaging a certified partner is highly recommended to ensure your governance framework meets national security standards and enterprise scalability needs. We provide the technical expertise required to automate access controls and manage tenant administration effectively. This proactive approach prevents the common "governance nightmares" of workspace sprawl and inconsistent data security that often plague unguided implementations.
What is the role of DAX optimization in enterprise reporting performance?
DAX optimization is the most critical factor in ensuring that enterprise reports remain responsive as data volumes grow. Even with high-performance hardware, inefficient calculations can create significant latency for end users. Refining your data measures and relationships ensures that your BI environment remains snappy and reliable, which is essential for maintaining high adoption rates across the organization.
Can Tableau and Power BI coexist in the same organization?
Coexistence is possible but it often leads to duplicated pipelines and conflicting metrics across different departments. Managing two separate BI ecosystems increases licensing costs and complicates your data governance strategy. Most successful enterprises aim for platform consolidation to simplify their vendor landscape and ensure every department is working from the same validated numbers.
How does Microsoft Fabric change the data lakehouse vs warehouse design choice?
Microsoft Fabric unifies lakehouse and warehouse concepts by using the Delta Parquet format as a universal standard. This architectural shift means you no longer have to choose between the flexibility of a data lake and the structured performance of a warehouse. It allows your enterprise to store data once in OneLake and access it through multiple compute engines, streamlining your entire data lifecycle.