The Ultimate Power BI Dashboard Optimization Checklist for 2026
Boost report speed with our 2026 checklist for Power BI dashboard optimization. Learn to fix lag, refine DAX, and cut cloud costs for sub-second performance.
- Identify the exact source of report lag by distinguishing between data engine, DAX, and visual rendering times.
- Build a high-performance foundation using Star Schema architecture and the most efficient storage modes for 2026 workloads.
- Master Power BI dashboard optimization by refining DAX logic and minimizing the use of resource-heavy iterator functions.
- Reduce cloud compute costs through proactive governance of Fabric capacity settings and gateway performance.
- Shift from one-time fixes to a sustainable performance culture through continuous monitoring and performance-first design principles.
If your executive team waits more than three seconds for a visual to load, they aren't just losing time; they're losing trust in your data. You've likely experienced the frustration of high latency in DirectQuery reports or watched your semantic models bloat until they hit capacity limits. It's a common challenge as data volume outpaces architecture, but effective Power BI dashboard optimization is no longer just about cleaning up a few columns. It's about building a high-performance engine that supports rapid growth while keeping cloud compute costs under control.
We know that a sluggish report is more than a technical glitch; it's a barrier to informed decision-making. You've worked hard to build your data culture, and we're here to help you protect it. This guide provides a definitive checklist to master the technical and strategic steps needed to achieve sub-second interaction. We'll explore how to leverage the latest 2026 features, including the PBIR format and AI-assisted modeling, to transform your environment. By moving systematically from data model foundations to DAX engine refinement, you'll turn technical bottlenecks into scalable business assets that drive real value.
Phase 1: Diagnosing Performance Bottlenecks
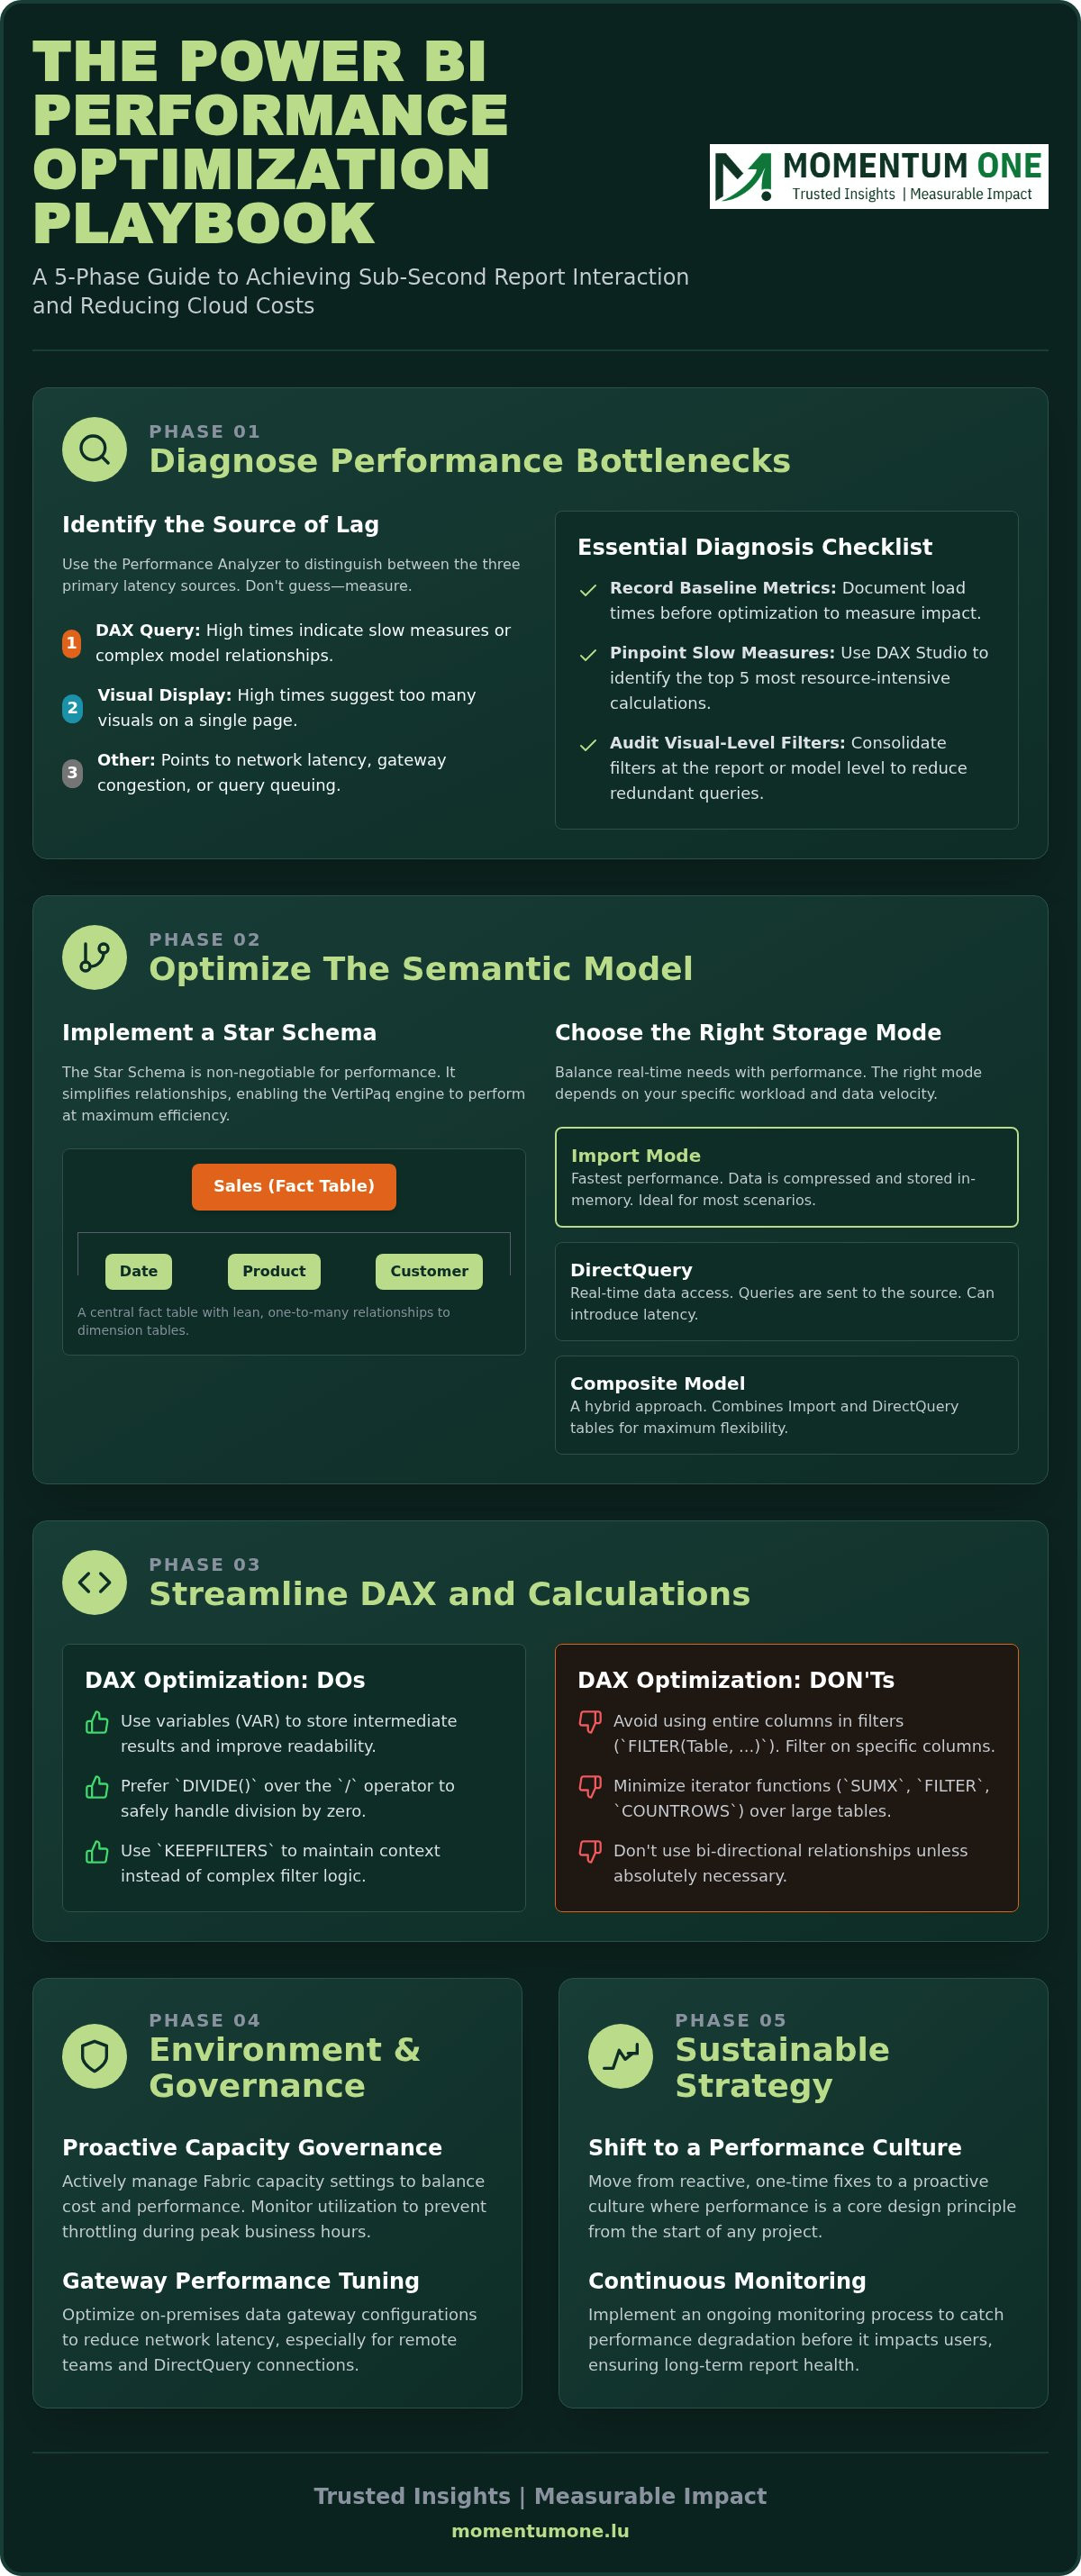
Effective diagnosis is the foundation of any successful Power BI dashboard optimization project. You can't fix what you can't measure; guessing which visual or measure is causing lag often leads to wasted effort and missed targets. We start by opening the Performance Analyzer in Power BI Desktop or the Service to capture exactly what happens when a user interacts with a slicer or navigates to a new page. This tool provides a transparent view of the engine's mechanics, breaking down the time spent on every element on the canvas.
We often see teams jump straight into rewriting DAX without looking at the broader Microsoft Power BI overview of how data flows from source to screen. It's vital to identify if the lag comes from a complex calculation, a slow data source, or simply having too many charts on one page. For organizations managing operations across Luxembourg, network latency remains a significant factor. A report that loads instantly at a central office might experience delays for remote teams due to local gateway bottlenecks or high-latency DirectQuery connections. Identifying "heavy" visuals that trigger excessive queries per page is a quick win for improving the user experience.
The Performance Analyzer Checklist
- Record baseline metrics: Document the load times for every report page before starting any optimization work. This "before" snapshot is essential to prove the value of your changes.
- Identify the "Top 5" slowest measures: Use the DAX Studio integration to pinpoint which measures are taxing the VertiPaq engine. This tool offers a deeper look into query plans than the standard analyzer.
- Audit visual-level filters: Check for filters applied to individual visuals that could be moved to the semantic model or a report-level filter. Consolidating logic reduces the number of redundant processes the engine must run.
Distinguishing Model vs. Visual Issues
Interpreting the Performance Analyzer results requires a methodical approach. If you see high numbers in the "Other" category, your problem usually isn't the code. It often suggests network latency, gateway congestion, or visuals waiting for other queries to finish. When the "DAX Query" time is high, the issue lies in your measures or model relationships. High "Visual Display" times indicate you've crowded the dashboard with too many elements. In our Power BI Consulting & Governance work, we've found that reducing the visual count by even 20% can lead to a 50% improvement in perceived speed for the end-user. Each visual triggers at least one query; streamlining the layout is often the fastest path to a high-performance business asset.
Phase 2: Optimizing the Semantic Model Architecture
Once you've diagnosed your bottlenecks, the next step in Power BI dashboard optimization is refining the underlying architecture. The semantic model acts as the engine room of your analytics environment. If the architecture is flawed, even the most elegant DAX will struggle to perform. We focus on creating a model that's lean, logical, and designed for the VertiPaq engine's columnar storage. This proactive approach ensures your reports remain responsive as your data volume grows.
Implementing a strict Star Schema is non-negotiable for high-performance reports. While some argue that flat tables or "snowflaking" are easier to build, they force the engine to traverse complex relationship chains, adding unnecessary milliseconds to every interaction. In a proper Star Schema, your fact tables are lean and surrounded by descriptive dimension tables. This structure isn't just about speed; it's about improving report accuracy by ensuring a clear, one-to-many relationship flow that the engine can optimize effectively.
Choosing the right storage mode is equally critical for 2026 workloads. While Import mode remains the fastest for most scenarios, the rise of Microsoft Fabric and real-time requirements has made Composite models more prevalent. For deep dives into these architectural choices, the Microsoft e-book Advanced Analytics with Power BI provides excellent guidance on balancing performance with real-time data needs. We always recommend evaluating if DirectQuery is truly necessary, as it often introduces latency that could be avoided with a well-timed Import refresh.
The Star Schema Advantage
A well-designed Star Schema minimizes the number of joins required to satisfy a query. We recommend using integer keys for relationships instead of long string-based IDs. Integers are significantly more efficient for the engine to process and store. You should also ensure that your dimension tables are truly "wide" with all necessary attributes, rather than having multiple linked tables that require the engine to jump through hoops. This simplicity is the secret to sub-second report interactions.
Data Reduction Techniques
Memory is the currency of Power BI. To keep your models fast, you must reduce data volume at the Power Query level. Every column you import that isn't used in a visual or a measure is dead weight. We've seen models shrink by 40% simply by removing high-cardinality columns like GUIDs or raw timestamps that aren't needed for analysis. Reducing the memory footprint is the most direct way to lower your cloud compute costs.
- Disable "Auto Date/Time" settings: This prevents Power BI from creating hidden calendar tables for every date column, which can bloat your model size significantly.
- Summarize data at the required grain: Don't import raw transactional logs if your users only need to see daily or monthly totals. Aggregation is a powerful tool for performance.
- Optimize data types: Ensure that numeric columns are set to the smallest possible precision. The VertiPaq engine thrives on data that is easy to compress.
If your current model feels like a technical bottleneck, our team can help you through specialized data architecture modernization to ensure your foundation is ready for growth.
Phase 3: Streamlining DAX and Calculation Logic
After refining your architecture, the next frontier in Power BI dashboard optimization is the DAX engine. Even with a perfect Star Schema, inefficient DAX can bring your reports to a crawl. Streamlining your calculation logic is about more than just getting the right answer; it's about ensuring those answers arrive instantly. In our work with clients, we often find that a few targeted changes to measure logic can reduce load times by several seconds. This phase focuses on reducing the workload of the VertiPaq engine by writing cleaner, more intentional code.
Start by replacing standard operators with safer, more efficient functions. For example, using the DIVIDE function instead of the forward slash (/) prevents "divide by zero" errors while often performing better in complex visuals. Similarly, using Variables (VAR) is a simple way to boost performance. Variables store the result of an expression as a constant within the measure, preventing the engine from recalculating the same logic multiple times during a single query cycle. It's a straightforward habit that makes your code more readable and your reports much snappier.
Iterators like SUMX, AVERAGEX, and FILTER are frequently misunderstood. While they are necessary for row-level logic, they force the engine to work row-by-row rather than using its native columnar speed. Whenever possible, move these calculations "upstream" to Power Query or your data source. If you can pre-calculate a value before it reaches the semantic model, you save the engine from doing that work every time a user clicks a slicer. This proactive approach keeps your model lean and responsive.
Efficient Calculation Patterns
Mastering the CALCULATE function is essential for high-performance reporting. A common mistake is passing an entire table as a filter argument, which forces the engine to scan every column in that table. Instead, apply filters to specific columns to minimize the data footprint. DAX optimization is the art of reducing the engine’s scanning workload. By narrowing the scope of your filters, you allow Power BI to focus only on the data points that matter, resulting in much faster response times for the end-user.
The Role of DAX Optimization Experts
There comes a point where DAX isn't the right tool for every calculation. If your logic is overly complex or your Row-Level Security (RLS) is causing significant lag, it's time to consider moving that logic to the SQL backend or a Microsoft Fabric Lakehouse. Complex RLS adds a heavy processing layer to every measure, so keeping security logic lean is vital for scalability. Our team specializes in Data Modeling & DAX Optimization to help you navigate these technical trade-offs. We work as your dedicated partners to ensure your calculations are as fast as they are accurate, turning technical bottlenecks into reliable business value.
Phase 4: Environment and Governance Optimization
Optimizing the report file itself is only half the battle. To achieve comprehensive Power BI dashboard optimization, you must refine the cloud environment where those reports live and breathe. Even a perfectly designed model will struggle if it's competing for limited resources on an overstretched capacity. This phase focuses on the structural and administrative settings that ensure your high-performance reports stay fast as your user base grows.
Start by auditing your resource allocation. As of July 2026, organizations are increasingly moving toward Microsoft Fabric F-SKUs to manage their workloads. For instance, the F64 SKU, which costs approximately $8,410 per month on a pay-as-you-go basis, becomes a strategic breakeven point once you hit 600 Pro viewers. We recommend using the Fabric Capacity Metrics app to identify peak usage stress. If you see consistent "smoothing" or "throttling" events, it's a clear sign that your environment needs adjustment to maintain sub-second responsiveness.
Gateway performance is another common technical bottleneck. We often see environments where dozens of redundant data sources create unnecessary congestion. Consolidating these sources and staggering refresh schedules prevents the "morning rush" that can slow down dashboards for every user in the organization. If you need a partner to help balance these complex settings, our Workspace & Capacity Optimization team can help you fine-tune your environment for maximum efficiency.
Microsoft Fabric Integration in 2026
The unified architecture of Microsoft Fabric has fundamentally changed how we approach performance. By leveraging OneLake, you eliminate the need for redundant data movement, which traditionally adds latency to the analytics lifecycle. Direct Lake mode is particularly transformative for 2026 workloads; it allows you to achieve sub-second performance on massive datasets by reading directly from Parquet files. This bypasses the need for traditional Import refreshes, keeping your data fresh and your queries incredibly fast.
Governance for Performance
Governance isn't just about security; it's a vital tool for long-term speed. Implementing a "Certified Dataset" strategy encourages your team to reuse already optimized models rather than building new, unrefined ones from scratch. This reduces "report sprawl" and ensures that the most critical business metrics are served by your most efficient architecture. Additionally, scheduling data refreshes outside of peak business hours preserves capacity for interactive user queries. For a deeper look at maintaining these standards at scale, see our guide on Managed Power BI Services.
Phase 5: Sustainable Optimization Strategy
Sustainable Power BI dashboard optimization isn't a one-time project. It's a continuous commitment to excellence. As your data grows and business needs evolve, even the most refined reports can drift into inefficiency. Establishing a monitoring cycle ensures you catch performance degradation before it impacts your end-users. We've seen that the most successful organizations treat performance as a living metric, not a checkbox on a deployment list.
Automating performance alerts is a vital step in this process. By setting thresholds in the Fabric Capacity Metrics app or using custom monitoring tools, you can receive notifications when a report's load time exceeds a specific benchmark, such as three seconds. This allows your team to address issues proactively rather than waiting for a frustrated executive to report a laggy dashboard. It's about maintaining the trust you've built in your data through consistent, reliable speed.
Building a Performance Culture
Technology alone can't maintain speed; your people are the most important part of the equation. Standardizing report templates with a limited number of high-impact visuals prevents authors from over-crowding pages. We also recommend implementing peer reviews for new DAX measures. This collaborative approach ensures that only optimized, vetted logic makes it into your production environment, reducing technical debt before it even begins.
Upskilling your internal team is the most effective way to prevent future bottlenecks. Our Corporate Power BI Training provides your authors with the performance-first design principles they need to build right the first time. When everyone understands the impact of a heavy iterator or a bloated visual, the entire environment becomes more stable and scalable. It's an investment that pays dividends in reduced compute costs and higher user satisfaction.
Next Steps with Momentum One
We're dedicated to your long-term success. By partnering with specialists for regular reviews, you ensure that your Power BI environment supports your growth rather than hindering it. Let's work together to transform your sluggish reports into high-performance assets that drive informed decision-making across your organization. Optimise your Power BI environment today and build a data ecosystem that's truly ready for the future.
Take Control of Your Data Performance
Achieving peak performance in 2026 requires a shift from reactive troubleshooting to a proactive, architectural approach. By mastering Power BI dashboard optimization through the five phases we've covered, you turn technical debt into a competitive advantage. You've learned how to diagnose bottlenecks, refine your semantic models, and leverage the speed of Microsoft Fabric. Now, the focus shifts to maintaining that momentum as your organization scales.
The complexity of modern data stacks means that hidden inefficiencies can often linger in even the most well-designed reports. As a Certified Microsoft Solutions Partner with over 8 years of experience in the ecosystem, we specialize in expert DAX troubleshooting for enterprise datasets. We're here to help you bridge the gap between "working" and "high-performance" while ensuring your architecture remains future-proof.
If you're ready to eliminate lag and reduce cloud compute costs, we invite you to Request a Professional Power BI Performance Audit. Our boutique approach ensures your unique business goals are always the priority. Let's build a fast, reliable BI environment that empowers your team to make better decisions with confidence.
Frequently Asked Questions
The Performance Analyzer Checklist
Record baseline metrics: Document the load times for every report page before starting any optimization work. This "before" snapshot is essential to prove the value of your changes. Identify the "Top 5" slowest measures: Use the DAX Studio integration to pinpoint which measures are taxing the VertiPaq engine. This tool offers a deeper look into query plans than the standard analyzer. Audit visual-level filters: Check for filters applied to individual visuals that could be moved to the semantic model or a report-level filter. Consolidating logic reduces the number of redundant processes the engine must run.
Distinguishing Model vs. Visual Issues
Interpreting the Performance Analyzer results requires a methodical approach. If you see high numbers in the "Other" category, your problem usually isn't the code. It often suggests network latency, gateway congestion, or visuals waiting for other queries to finish. When the "DAX Query" time is high, the issue lies in your measures or model relationships. High "Visual Display" times indicate you've crowded the dashboard with too many elements. In our Power BI Consulting & Governance work, we've found that reducing the visual count by even 20% can lead to a 50% improvement in perceived speed for the end-user. Each visual triggers at least one query; streamlining the layout is often the fastest path to a high-performance business asset. Once you've diagnosed your bottlenecks, the next step in Power BI dashboard optimization is refining the underlying architecture. The semantic model acts as the engine room of your analytics environment. If the architecture is flawed, even the most elegant DAX will struggle to perform. We focus on creating a model that's lean, logical, and designed for the VertiPaq engine's columnar storage. This proactive approach ensures your reports remain responsive as your data volume grows. Implementing a strict Star Schema is non-negotiable for high-performance reports. While some argue that flat tables or "snowflaking" are easier to build, they force the engine to traverse complex relationship chains, adding unnecessary milliseconds to every interaction. In a proper Star Schema, your fact tables are lean and surrounded by descriptive dimension tables. This structure isn't just about speed; it's about improving report accuracy by ensuring a clear, one-to-many relationship flow that the engine can optimize effectively. Choosing the right storage mode is equally critical for 2026 workloads. While Import mode remains the fastest for most scenarios, the rise of Microsoft Fabric and real-time requirements has made Composite models more prevalent. For deep dives into these architectural choices, the Microsoft e-book Advanced Analytics with Power BI provides excellent guidance on balancing performance with real-time data needs. We always recommend evaluating if DirectQuery is truly necessary, as it often introduces latency that could be avoided with a well-timed Import refresh.
The Star Schema Advantage
A well-designed Star Schema minimizes the number of joins required to satisfy a query. We recommend using integer keys for relationships instead of long string-based IDs. Integers are significantly more efficient for the engine to process and store. You should also ensure that your dimension tables are truly "wide" with all necessary attributes, rather than having multiple linked tables that require the engine to jump through hoops. This simplicity is the secret to sub-second report interactions.
Data Reduction Techniques
Memory is the currency of Power BI. To keep your models fast, you must reduce data volume at the Power Query level. Every column you import that isn't used in a visual or a measure is dead weight. We've seen models shrink by 40% simply by removing high-cardinality columns like GUIDs or raw timestamps that aren't needed for analysis. Reducing the memory footprint is the most direct way to lower your cloud compute costs. If your current model feels like a technical bottleneck, our team can help you through specialized data architecture modernization to ensure your foundation is ready for growth. After refining your architecture, the next frontier in Power BI dashboard optimization is the DAX engine. Even with a perfect Star Schema, inefficient DAX can bring your reports to a crawl. Streamlining your calculation logic is about more than just getting the right answer; it's about ensuring those answers arrive instantly. In our work with clients, we often find that a few targeted changes to measure logic can reduce load times by several seconds. This phase focuses on reducing the workload of the VertiPaq engine by writing cleaner, more intentional code. Start by replacing standard operators with safer, more efficient functions. For example, using the DIVIDE function instead of the forward slash (/) prevents "divide by zero" errors while often performing better in complex visuals. Similarly, using Variables (VAR) is a simple way to boost performance. Variables store the result of an expression as a constant within the measure, preventing the engine from recalculating the same logic multiple times during a single query cycle. It's a straightforward habit that makes your code more readable and your reports much snappier. Iterators like SUMX, AVERAGEX, and FILTER are frequently misunderstood. While they are necessary for row-level logic, they force the engine to work row-by-row rather than using its native columnar speed. Whenever possible, move these calculations "upstream" to Power Query or your data source. If you can pre-calculate a value before it reaches the semantic model, you save the engine from doing that work every time a user clicks a slicer. This proactive approach keeps your model lean and responsive.
Efficient Calculation Patterns
Mastering the CALCULATE function is essential for high-performance reporting. A common mistake is passing an entire table as a filter argument, which forces the engine to scan every column in that table. Instead, apply filters to specific columns to minimize the data footprint. DAX optimization is the art of reducing the engine’s scanning workload. By narrowing the scope of your filters, you allow Power BI to focus only on the data points that matter, resulting in much faster response times for the end-user.
The Role of DAX Optimization Experts
There comes a point where DAX isn't the right tool for every calculation. If your logic is overly complex or your Row-Level Security (RLS) is causing significant lag, it's time to consider moving that logic to the SQL backend or a Microsoft Fabric Lakehouse. Complex RLS adds a heavy processing layer to every measure, so keeping security logic lean is vital for scalability. Our team specializes in Data Modeling & DAX Optimization to help you navigate these technical trade-offs. We work as your dedicated partners to ensure your calculations are as fast as they are accurate, turning technical bottlenecks into reliable business value. Optimizing the report file itself is only half the battle. To achieve comprehensive Power BI dashboard optimization, you must refine the cloud environment where those reports live and breathe. Even a perfectly designed model will struggle if it's competing for limited resources on an overstretched capacity. This phase focuses on the structural and administrative settings that ensure your high-performance reports stay fast as your user base grows. Start by auditing your resource allocation. As of July 2026, organizations are increasingly moving toward Microsoft Fabric F-SKUs to manage their workloads. For instance, the F64 SKU, which costs approximately $8,410 per month on a pay-as-you-go basis, becomes a strategic breakeven point once you hit 600 Pro viewers. We recommend using the Fabric Capacity Metrics app to identify peak usage stress. If you see consistent "smoothing" or "throttling" events, it's a clear sign that your environment needs adjustment to maintain sub-second responsiveness. Gateway performance is another common technical bottleneck. We often see environments where dozens of redundant data sources create unnecessary congestion. Consolidating these sources and staggering refresh schedules prevents the "morning rush" that can slow down dashboards for every user in the organization. If you need a partner to help balance these complex settings, our Workspace & Capacity Optimization team can help you fine-tune your environment for maximum efficiency.
Microsoft Fabric Integration in 2026
The unified architecture of Microsoft Fabric has fundamentally changed how we approach performance. By leveraging OneLake, you eliminate the need for redundant data movement, which traditionally adds latency to the analytics lifecycle. Direct Lake mode is particularly transformative for 2026 workloads; it allows you to achieve sub-second performance on massive datasets by reading directly from Parquet files. This bypasses the need for traditional Import refreshes, keeping your data fresh and your queries incredibly fast.
Governance for Performance
Governance isn't just about security; it's a vital tool for long-term speed. Implementing a "Certified Dataset" strategy encourages your team to reuse already optimized models rather than building new, unrefined ones from scratch. This reduces "report sprawl" and ensures that the most critical business metrics are served by your most efficient architecture. Additionally, scheduling data refreshes outside of peak business hours preserves capacity for interactive user queries. For a deeper look at maintaining these standards at scale, see our guide on Managed Power BI Services. Sustainable Power BI dashboard optimization isn't a one-time project. It's a continuous commitment to excellence. As your data grows and business needs evolve, even the most refined reports can drift into inefficiency. Establishing a monitoring cycle ensures you catch performance degradation before it impacts your end-users. We've seen that the most successful organizations treat performance as a living metric, not a checkbox on a deployment list. Automating performance alerts is a vital step in this process. By setting thresholds in the Fabric Capacity Metrics app or using custom monitoring tools, you can receive notifications when a report's load time exceeds a specific benchmark, such as three seconds. This allows your team to address issues proactively rather than waiting for a frustrated executive to report a laggy dashboard. It's about maintaining the trust you've built in your data through consistent, reliable speed.
Building a Performance Culture
Technology alone can't maintain speed; your people are the most important part of the equation. Standardizing report templates with a limited number of high-impact visuals prevents authors from over-crowding pages. We also recommend implementing peer reviews for new DAX measures. This collaborative approach ensures that only optimized, vetted logic makes it into your production environment, reducing technical debt before it even begins. Upskilling your internal team is the most effective way to prevent future bottlenecks. Our Corporate Power BI Training provides your authors with the performance-first design principles they need to build right the first time. When everyone understands the impact of a heavy iterator or a bloated visual, the entire environment becomes more stable and scalable. It's an investment that pays dividends in reduced compute costs and higher user satisfaction.
Next Steps with Momentum One
Moving from reactive troubleshooting to a proactive, managed BI environment requires a strategic partner. A professional audit can uncover hidden bottlenecks in your data stack that might not be visible through standard tools. Whether it's a deep architectural review or a specialized DAX audit, our team provides the expert facilitation needed to turn complex technical challenges into streamlined business value. We don't just fix reports; we build scalable foundations. We're dedicated to your long-term success. By partnering with specialists for regular reviews, you ensure that your Power BI environment supports your growth rather than hindering it. Let's work together to transform your sluggish reports into high-performance assets that drive informed decision-making across your organization. Optimise your Power BI environment today and build a data ecosystem that's truly ready for the future. Achieving peak performance in 2026 requires a shift from reactive troubleshooting to a proactive, architectural approach. By mastering Power BI dashboard optimization through the five phases we've covered, you turn technical debt into a competitive advantage. You've learned how to diagnose bottlenecks, refine your semantic models, and leverage the speed of Microsoft Fabric. Now, the focus shifts to maintaining that momentum as your organization scales. The complexity of modern data stacks means that hidden inefficiencies can often linger in even the most well-designed reports. As a Certified Microsoft Solutions Partner with over 8 years of experience in the ecosystem, we specialize in expert DAX troubleshooting for enterprise datasets. We're here to help you bridge the gap between "working" and "high-performance" while ensuring your architecture remains future-proof. If you're ready to eliminate lag and reduce cloud compute costs, we invite you to Request a Professional Power BI Performance Audit. Our boutique approach ensures your unique business goals are always the priority. Let's build a fast, reliable BI environment that empowers your team to make better decisions with confidence.
Why is my Power BI dashboard slow even with a small dataset?
A small dataset doesn't guarantee speed if the underlying logic is inefficient. High visual counts and complex, unoptimized DAX measures force the engine to work harder than necessary. Poor data modeling, such as using a Snowflake schema instead of a Star Schema, also adds significant processing overhead. You should examine your relationship logic and measure complexity to find the true source of the lag.
What is the ideal number of visuals per Power BI report page?
We generally recommend keeping the number of visuals between 8 and 10 per page to maintain optimal performance. Every visual on your canvas triggers at least one query to the engine. When you exceed this range, the browser and the Power BI service must manage multiple parallel requests; this often leads to visible rendering delays and a poor user experience.
How does DirectQuery affect Power BI dashboard optimization?
DirectQuery often introduces latency because it relies on the speed of the source database and network connectivity. Unlike Import mode, which uses the fast VertiPaq engine, DirectQuery sends real-time requests to the backend. This makes Power BI dashboard optimization more complex, as you must fine-tune both the report and the source system to ensure queries return in under a second.
Can Microsoft Fabric improve my existing Power BI report speed?
Microsoft Fabric can significantly improve speed by using Direct Lake mode, which reads Parquet files directly from OneLake. This architecture provides the performance of Import mode with the real-time benefits of DirectQuery. Moving your reports into a Fabric environment eliminates the need for traditional data refreshes, allowing you to handle massive datasets with sub-second responsiveness without traditional bottlenecks.
How do I identify which DAX measure is slowing down my report?
You can identify problematic logic by using the Performance Analyzer tool within Power BI Desktop. It breaks down the time spent on DAX queries, visual display, and other background processes. For deeper analysis, we recommend integrating DAX Studio to trace query plans and see exactly how the engine scans your data. This data-driven approach removes the guesswork from your troubleshooting efforts.
Is Power BI Premium necessary for better dashboard performance?
Power BI Premium isn't always necessary for speed, but it offers dedicated capacity that prevents performance degradation during peak usage. While Pro licenses share resources with other tenants, Premium or Fabric capacities provide more memory and parallel processing power. It becomes essential when you're managing large semantic models or require advanced features like Direct Lake mode for enterprise-scale reporting.
What is the difference between report optimization and model optimization?
Report optimization focuses on the front-end, such as reducing visual counts and streamlining slicers to improve rendering speed. Model optimization targets the back-end, including Star Schema design, data type refinement, and DAX efficiency. Both are critical for comprehensive Power BI dashboard optimization, as a fast model can still be slowed down by a cluttered and poorly designed report interface.
How often should I conduct a Power BI performance audit?
We recommend conducting a performance audit at least quarterly or whenever you make significant changes to your data architecture. Regular reviews help you catch performance drift caused by growing data volumes or new, unoptimized measures. A proactive schedule ensures that your high-performance environment remains stable and continues to provide business value without hitting unexpected capacity limits.